Prediction of maximum earthquake magnitude for northern vietnam region based on the gev distribution VJES 38
Bạn đang xem bản rút gọn của tài liệu. Xem và tải ngay bản đầy đủ của tài liệu tại đây (207.15 KB, 7 trang )
Vietnam Journal of Earth Sciences Vol.38 (4) 339-344
Vietnam Academy of Science and Technology
Vietnam Journal of Earth Sciences
(VAST)
/>
Prediction of maximum earthquake magnitude for
northern Vietnam region based on the gev distribution
Vu Thi Hoan *1, Ngo Thi Lu 1, Mikhail Rodkin 2 , N guyen Huu Tuyen 1, Phung Thi Thu Hang1,
Tran Viet Phuong1
T
0
6
P
P
R
R
P
P
P
P
P
P
P
P
P
P
P
1
Institute of Geophysics, Vietnam Academy of Science and Technology
TP
0
6
P
2
International Institute of Earthquakes Prediction Theory and Mathematical Geophysics, RAS, Moscow
TP
0
6
T
0
6
P
T
0
6
Received 1 March 2016. Accepted 15 December 2016
ABSTRACT
The present work is a continuation and improvement of the application of the generalized extreme value
distribution to study the seismicity of the Southeast Asia. We have applied the generalized extreme value distribution
(GEV) method to estimate maximum magnitude value (M max ) for the earthquake catalog of Northern Vietnam. Using
this method, we obtain the distribution of maximum earthquake magnitude values. This distribution can be
characterized by its quantile Q q (τ) at any desirable statistical level q. The quantile Q q (τ) provides a much more stable
and robust characteristic than the traditional absolute maximum magnitude M max (M max can be obtained as the limit
of Q q (τ) as q → 1, τ → ∞). The parameters have been obtained: ζ = - 0.178 ± 0.08 ; σ = 0.23 ± 0.08; µ = 4.39 ± 0.16;
M max = 6.8 with the probability of 98% for period 2014 - 2064.
R
R
T
2
5
R
R
R
R
R
T
2
5
R
R
R
R
R
R
R
Keywords: Maximum magnitude (M max ), generalized extreme value distribution (GEV), earthquake prediction,
seismic hazard.
R
R
©2016 Vietnam Academy of Science and Technology
1. Introduction 1
F
0
P
The NorthernVietnam region is the most
active tectonic and high potential risk area of
Vietnam. The parameter M max represents the
maximum of possible earthquake magnitude
in the study region. This parameter plays a
very important role in seismic hazard
assessment and mitigation of the seismic risk.
Giving a reliable estimate of M max , it is
comparatively easy to take adequate decisions
on the construction standards of buildings or
R
R
R
*
R
Corresponding author, Email:
on the insurance policy (Pisarenko et al.,
2014b). Therefore, the maximum magnitude
earthquake prediction is not only the task with
the scientific sense but also an imperative task
for the seismic practice of Vietnam.
There are many methods to assess
maximum earthquake magnitude including the
geological extrapolation (Phan et al., 2012,
2013), calculation of M max base on size of
earthquake source zone (Nguyen N.T et al.,
2005; Bui et al., 2013), probabilistic
methods... (Gumbel, 1958; Nguyen H.P, 1991,
Nguyen N.T et al., 2005, Nguyen H.P et al.,
R
R
339
Vu Thi Hoan, et al./Vietnam Journal of Earth Sciences 38 (2016)
1997, 2001, 2014). One of the probabilistic
methods is based on the generalized extreme
value distribution (GEV). This method is
introduced by Pisarenko et al. for the Harvard
catalog (Pisarenko et al., 2007, 2008), the
catalogs of Japan (Pisarenko et al., 2010) and
Vietnam (Pisarenko et al., 2012). We used this
method to assess M max for Southeast Asia and
Pr edict
obtained M max
= 8,235 for period 2013 2063 with probability 98% (Vu et al.,
2014). In this work we continue to use this
method to assess M max for the Northern
Pr edict
Vietnam and obtained M max
= 6,8 for period
2014 -2064 with probability 98% .
R
T
2
5
R
T
2
5
R
R
2. Methodology and used data
2.1. Used data
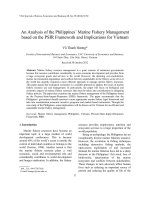
The study area is limited by the
coordinates φ = 17° ÷ 24°N; λ = 102° ÷ 110°E
(Figure 1).
We collect data from various sources: the
Department of the seismological survey, the
Earthquake Information and Tsunami
Warning Centre, the previously published
earthquake catalog on the territory of Vietnam
and the data from International Seismological
T
2
T
2
T
2
T
2
T
2
T
2
T
2
T
2
Center - ISC. In the data from ISC, an
earthquake can have 4 types of magnitude:
Local magnitude (M L ), body - wave
magnitude (m b ), surface - wave magnitude
(M s ), moment magnitude (M w ). However, as
M L is the most common magnitude used in
Vietnam, the M L values were chosen for the
entire catalog. It is possible to convert m b, M s,
M w values to M L. The collected data
have 1376 earthquakes with magnitudes
M = 1.7-7.5.
After separation of foreshocks and
aftershocks from this earthquake catalog, we
get independent earthquake catalog including
1196 independent earthquakes with magnitude
1.7 ≤ M ≤ 7.5 for Northern Vietnam and
surrounding regions.
The data in this catalog are continuous on
time since 1972, so we chose the period from
1972 to 2014 for estimation of M max . There
are 349 earthquakes with M ≥ 4.1 in the
period.
R
R
R
R
R
R
R
R
R
R
R
R
R
R
R
R
R
R
1 �
∑ (�
� �=1 �
− �1)3 = ( �)3 �−2(�(−�))3 −
where Γ(x) is the Gamma function: Γ (t)
∞
= ∫0 � �−1 � −� �� , n is the number of
earthquakes in each T-intervals, x k is
magnitude of kth earthquake.
R
P
340
P
R
R
R
2.2. Prediction method
The distribution function generalized
extreme value is defined as follows (Pisarenko
et al., 2007, 2008, 2010):
GEV(x |σ, µ, ζ)
exp( −(1 + (ζ/σ)⋅(x – µ))– 1/ζ, ζ < 0; σ > 0; �≤µ − σ/ζ, ζ ≠ 0
x –µ
=�
�� ,
ζ=0
exp �– exp �−
σ
Where x is variable representing the
magnitude earthquake value, σ is the scale
parameter, µ is the location parameter, ζ is the
form parameter.
To determine the GEV function we need to
identify 3 parameters ζ, σ, µ in formula (1).
These parameters ζ, σ, µ are determined in
R
R
(1)
each period T, by solving the set of three
equations below:
1 �
∑
�
� �=1 �
�
�
�
�
= µ − + �(1 − �) = �1
1 �
∑ (�
� �=1 �
2
�
�
(2)
− �1)2 = ( )2 ��(1 − 2�) −
��(1 − �)� � = �2
6
�(−�)�(−2�)
�
−
3
�(−3�)�
�2
(3)
= �3
(4)
It is important to determine T-intervals to
suit each catalog because T-intervals have the
influence on the values of the three
parameters ζ, σ, µ of the GEV function. To
Vietnam Journal of Earth Sciences Vol.38 (4) 339-344
(7)
µ(τ) = µ(T) + (σ(T) /ξ)⋅((τ/T)ξ - 1) ;
- The quantile in this period is:
Q q (τ) = h + (s/ξ)⋅(a⋅(λτ)ξ - 1)
find T-intervals, we need to determine the
density Poisson distribution (λ) of the
magnitude earthquake values:
�
, where N is the number of
λ =
�
independent earthquakes, t is the time
between the first event and the last event.
The chosen T-values (days) must satisfy
three conditions:
All T-intervals are non-empty.
Value 1 / λT → 0 (with λ is the frequency
earthquakes with magnitude M ≥ m).
Value of parameter ζ is stable enough to
determine the GEV function.
The following steps should be taken:
- Choose an interval of values (T L ; T H ) for
time interval durations T, for which the
catalog still contains a sufficient number of Tintervals (with T L is the lowest time; T H is the
highest time) ;
- Choose in this interval (T L ; T H ) a
finite set of u time-interval durations T
(T L ≤ T 1 < T 2 <…< T u ≤ T H );
- The GEV parameters are estimated by the
method of moments (Pisarenko et al., 2007,
2008, 2010) for each of the u time - interval
durations T, which yields the following set of
parameters:
ζ( T 1 ), ζ( T 2 ),..., ζ( T u ), σ( T 1 ), σ( T 2 ), ...,
σ( T u ), µ( T 1 ), µ( T 2 ),..., µ( T u );
- To estimate the average values ζ , σ ,
µ of the GEV parameters ζ, σ, µ
- The τ is the predicted period (from the
time of the earthquake event was chosen as
supporting event). The parameters ζ, σ, µ are
represented as the functions of τ by the
formulas (5-7) below:
ζ(τ) = ζ(T);
(5)
(6)
σ(τ) = σ(T)⋅(τ/T)ξ;
R
R
R
R
R
R
R
R
R
R
R
R
R
R
R
R
R
R
R
R
R
R
R
R
R
R
R
R
P
R
R
R
R
R
R
R
P
Table 1. The parameters T, λT, 1 / λT
T
255
265
275
285
λT
5.735 5.960 6.185 6.410
1/λT
0.174 0.168 0.162 0.156
R
P
R
P
P
(8)
where:
a = (log(1/q))-ξ ,
h = µ + (σ/ξ)⋅((λT)-ξ -1 ;
s = σ. (λT)-ξ.
When τ → ∞ then Q q (τ) =
M max (τ)→M max :
(9)
M max predict = limτ→∞ Q q (τ)
Thus, after finding the appropriate Tintervals, three parameters ζ, σ, µ can be
found in each time period. The obtained
results can be used to determine the content of
GEV, decile point value of Q q (τ), and to
assess the M max value.
P
P
P
P
P
P
R
R
R
R
R
RP
R
R
P
R
R
R
R
3. Calculation results
R
R
R
R
R
P
295
6.635
0.151
In this section, we present the calculation
results for the given data set.
T
2
5
Step 1: Calculate the density Poisson
distribution (λ)
The period from 23/1/1972 (t 1 ) to
20/8/2014(t n ) used with the daily unit. The
total time are 15518.71 days. The number of
��− �1
T-intervals is n: n = ��������
�
Density λ Poisson distribution is calculated
as follows:
�
349
λ= =
= 0.02249
R
R
R
R
�
15518.71
Step 2: Select the jump (T)
According to the data in the catalog, to
satisfy the condition (a) above, the smallest
value of T-intervals is 250 days. The Tintervals in the corresponding product λT are
the following:
305
6.859
0.146
From this table, the greater T-intervals are,
the smaller value of the ratios (1/λT) are. In
T
2
5
315
7.084
0.141
325
7.309
0.137
335
7.534
0.133
345
7.759
0.129
355
7.984
0.125
365
8.209
0.122
principle, the closer values (1/λT) are to the
value "0", the better T-intervals are. However,
341
Vu Thi Hoan, et al./Vietnam Journal of Earth Sciences 38 (2016)
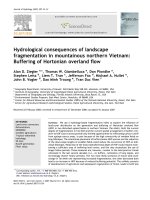
to satisfy the condition (c), Figure 2 shows an
approximate “stabilization” of the ζ- estimates
in the range 300 and 350 days. Therefore, to
satisfy the above conditions, the value of Tinterval is 350 days. With T = 350 days, then
��− �1
n= ��������
�
In order to estimate the Mean Square Error
(MSE) of these estimates, we use formulas
(Pisarenko et al., 2008):
MESζ = (1 / n )
MESσ = (1 / n )
= 44.
Step 3: Determine the parameters ζ , σ, µ
ζ( T 1 ), ζ( T 2 ),..., ζ( T u ), σ( T 1 ), σ( T 2 ), ...,
σ( T u ), µ( T 1 ), µ( T 2 ),..., µ( T u );
R
R
R
R
R
R
R
R
R
R
R
R
R
R
R
R
R
R
ζ = -0.178; σ = 0.23; µ = 4.39.
To estimate the average these values:
j =1
(ζ j −ζ ) 2
1/ 2
∑ (σ j −σ ) 2
MES µ = (1 / n )
In each u time-interval durations T (TL ≤
T1 < T2 <…< Tu ≤ TH), the parameters ζ, σ, µ
are determined in each period T, by solving
the set of three equations (2-4).
∑
n
n
j =1
∑
n
j =1
1/ 2
( µ j −µ )2
1/ 2
Therefore, the parameters are:
ζ = - 0.178 ± 0.08 ; σ = 0.23 ± 0.08; µ = 4.39
± 0.16.
Figure 2. Graph of the ζ (T) function
Step 4: Determine predicted M max
In the earthquake catalog used, the last
strogest
earthquake,
which
occurred
29.06.2014 with magnitude M = 4.4, has
satisfied above specified conditions. So we
have chosen this event as supporting event.
R
������� = lim Qq(τ)
����
R
τ→∝
With predicted probability 98%, we get the
342
T
2
5
T5
1
7
2
T5
1
7
2
T5
1
7
2
T5
1
7
2
graph of the function Q q (τ) in Figure 3.
T
2
5
R
R
T
2
5
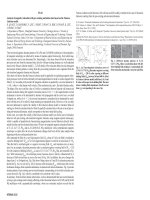
From figure 3, we have:
������� = lim
����
τ→10 Qq(τ) = 6,67;
������� = lim
����
τ→20 Qq(τ) = 6,72;
������� = lim
����
τ→30 Qq(τ) = 6,75;
�������
����
= limτ→40 Qq(τ) = 6,78;
������� = lim
����
τ→50 Qq(τ) = 6,8
Vietnam Journal of Earth Sciences Vol.38 (4) 339-344
τ (years)
Period
�������
����
10
2014-2024
6,67
20
2014-2034
6,72
30
2014-2044
6,75
40
2014-2054
6,78
50
2014-2064
6,80
Figure 3. Graph of the Q q (τ) function with q = 0.98 for the Northern Vietnam
R
R
maximum earthquake magnitude value was
assessed for the Northern Vietnam using GEV
method.
We obtained the following sample
estimates for this catalog with T = 350 days:
ζ = - 0.178 ± 0.08 ; σ = 0.23 ± 0.08; µ = 4.39
± 0.16;
This distribution can be characterized by
its quantile Q q (τ) at any desirable statistical
level q. With predicted probability 98%, we
������� = lim
obtained ����
τ→∝ Qq(τ) = 6.8 for
period 2014 - 2064.
The authors would like to thank for the
grants from the project research code
VAST.ĐL. 01 /14-16: “Development of a set
of programs for earthquake prediction by
combinations of the statistical, seismic,
geophysical and geomorphological methods,
and application to the Northwest region of
Vietnam” and the project research code
VAST.HTQT.NGA.08/15-16: “An approach
of the natural phenomena analysis and
computer performance for seismogenic
assessment of Vietnam territory”.
4. Discussions
Largest earthquake is predicted to occur in
the Northern Vietnam by GEV method is
������� = 6.8 in the next 50 years. This
����
result is quite consistent with the results
obtained in the work (Nguyen Ngoc Thuy,
2005), but there are differences compared to
the results in the works (Cao Dinh Trong,
2013) (M max = 6.7), (Ngo Thi Lu, 2012; Ngo
Thi Lu, 2016a, Ngo Thi Lu et al., 2016b)
(M max = 7.0); (Nguyen Hong Phuong 1991)
(M max = 7.0); Phan Trong Trinh et al., 2012)
(M max = 7.0); Pham Van Thuc and Kijko
(M max = 7.2); (Nguyen Hong Phuong, 1997)
(M max = 7.3). Such differences may be due to
the different studied
zones,
the methods
used and the limitations of the length of data
period considered (only in 42 years (19722014)).
R
R
R
R
R
R
R
R
R
R
R
R
R
5. Conclusions
On the basis of the catalog of independent
earthquakes in period 1972-2014, the
T
2
5
R
T
2
5
343
Vu Thi Hoan, et al./Vietnam Journal of Earth Sciences 38 (2016)
References
Bui Van Duan, Nguyen Cong Thang, Nguyen Van
Vuong, Pham Dinh Nguyen, 2013. The magnitude
of the largest possible earthquake in the Muong La Bac Yen fault zone. Vietnam Journal of Earth
Sciences 35, 1, 53.
Cao Dinh Trong, Le Van Dung, Pham Nam Hung, Mai
Xuan Bach, 2013. The neural network method for
intermediate earthquake prediction (example in
Vietnam). Journal of Marine Science and
Technology. 3A (V13), 17-24.
Gumbel E. J, 1958. Statistics of Extremes, Columbia
Univ. Press.
Ngo Thi Lu, Tran Viet Phuong, 2012. About the
approach to building algorithms and processes to
predict earthquakes by statistical model. Vietnam
Journal of Earth Scence, 34(4), 535-541.
Ngo Thi Lu, Tran Viet Phuong, 2013. Building a new
algorithm of the program for separation of forshock
and aftershock groups from earthquake catalog to
ensure the independence of the events. Journal of
Marine Science and Technology. 3A (V.13), 79-85.
Ngo Thi Lu, Tran Viet Phuong, 2016a. Prediction
earthquake (time, location and magnitude of an
earthquake) for the Northwest region of Vietnam by
program’s VAST. ĐL.01/14-16. Thematic reports,
14 pages.
Ngo Thi Lu, Rodkin M.V., Tran Viet Phuong, Phung
Thi Thu Hang, Nguyen Quang, Vu Thi Hoan,
2016b. Algorithm and program for earthquake
prediction based on the geological, geophysical,
geomorphological and seismic data. Vietnam
Journal of Earth Sciences. 38, 3, 231-241.
Nguyen Hong Phuong, 1991. Probabilistic assessment of
earthquake hazard in Vietnam based on
seismotectonic regionalization. Tectonophysics, 198,
81-93.
Nguyen Hong Phuong, 1997. Estimation of maximum
earthquake magnitudes for seismic source zones of
Vietnam using probabilistic methods. Contributions
of marine geology and geophysics. Vol. 3, pp.48-65.
Science and technics publishing house. Hanoi.
Nguyen Hong Phuong, 2001. Probabilistic Seismic
Hazard Assessment Along the Southeastern Coast of
Vietnam, Natural Hazards 24: 53-74.
Nguyen Hong Phuong, Pham The Truyen, 2014.
Probabilistic Seismic Hazard Assessment for the
South Central Vietnam. Vietnam Journal of Earth
Sciences 36, 451-461.
T
1
3
T
1
3
344
Nguyen Ngoc Thuy, 2005. Project report of KC. 08. 10:
“Zoning detailed forecast earthquake in the
Northwest of Vietnam”, 547 p.
Phan Trong Trinh , Ngo Van Liem, Nguyen Van Huong,
Hoang Quang Vinh, Bui Van Thom, Bui Thi Thao,
Mai Thanh Tan, Nguyen Hoang, 2012. Late
Quaternary tectonics and seismotectonics along the
Red River fault zone, North Vietnam. Earth-Science
Reviews 114, 224-235.
Phan Trong Trinh , Hoang Quang Vinh, Nguyen Van
Huong, Ngo Van Liem, 2013. Active fault
segmentation and seismic hazard in Hoa Binh
reservoir, Vietnam. Cent. Eur. J. Geosci. 5(2),
223-235
Pham Van Thuc and Kijko, A., 1985. Estimation of
maximum magnitude and seismic hazard in
Southeast Asia and Vietnam. Acta Geophys. Pol.,
XXX111 (4): 377-387.
Pisarenko V.F and Rodkin M.V, 2007. Distributions
with Heavy Tails: Application to the Analysis of
catastrophes, Coputational Seismology issue 38,
242p.
Pisarenko V.F, Sornette A, Sornette D and Rodkin M.V,
2008. New approach to the Characterization of M max
and of the Tail of the Distribution of Earthquake
Magnitudes. Pure and Applied Geophysics, 165,
pp 847-888.
Pisarenko V.F, Sornette D and Rodkin M.V, 2010.
Distribution of maximum Earthquake magnitudes in
future time intervals: application to the seismicity of
Japan (1923-2007). EPS (Earth, Planets and Space),
vol.62, pp 567-578.
Pisarenko V.F, Rodkin M.V, Ngo Thi Lu, 2012. New
general quantile approach to the seismic risk
assessment application to the Vietnam region.
Proceedings of the international scientific
conference, pp.161-167.
Pisarenko V.F, Rodkin M.V, and Rukavishnikova T. A,
2014a. Estimation of the Probability of Strongest
Seismic Disasters Based on the Extreme Value
Theory. Physics of the Solid Earth, 2014, Vol. 50,
No. 3, pp.311-324.
Pisarenko V.F, Sornette A, Sornette D and Rodkin M.V,
2014b. Characterization of the Tail of the
Distribution of Earthquake Magnitudes by
Combining the GEV and GPD Descriptions of
Extreme Value Theory. Pure Appl. Geophys. 171,
1599-1624.
R
R
Vietnam Journal of Earth Sciences Vol.38 (4) 339-344
Vu Thi Hoan, Ngo Thị Lu, M.V. Rodkin, Tran Viet
Phuong, 2014. Application of the generalized
extreme value distribution to study the seismicity of
the Southeast Asian. Journal of Geology. Series A,
2014, 341-345. Hanoi, Page. 180-189.
Http://www.isc.ac.uk/iscbulletin/search/bulletin/
T
6
5
T
6
5
345