Mutational signatures impact the evolution of anti EGFR antibody resistance in colorectal cancer
Bạn đang xem bản rút gọn của tài liệu. Xem và tải ngay bản đầy đủ của tài liệu tại đây (6.16 MB, 21 trang )
Articles
/>
Mutational signatures impact the evolution of
anti-EGFR antibody resistance in colorectal cancer
Andrew Woolston 1, Louise J. Barber1, Beatrice Griffiths1, Oriol Pich2, Nuria Lopez-Bigas2,3,4,
Nik Matthews5, Sheela Rao6, David Watkins6, Ian Chau6, Naureen Starling6, David Cunningham 6
and Marco Gerlinger 1,6 ✉
Anti-EGFR antibodies such as cetuximab are active against KRAS/NRAS wild-type colorectal cancers (CRCs), but acquired
resistance invariably evolves. It is unknown which mutational mechanisms enable resistance evolution and whether adaptive mutagenesis (a transient cetuximab-induced increase in mutation generation) contributes in patients. Here, we investigate these questions in exome sequencing data from 42 baseline and progression biopsies from cetuximab-treated CRCs.
Mutation loads did not increase from baseline to progression, and evidence for a contribution of adaptive mutagenesis was
limited. However, the chemotherapy-induced mutational signature SBS17b was the main contributor of specific KRAS/NRAS
and EGFR driver mutations that are enriched at acquired resistance. Detectable SBS17b activity before treatment predicted
shorter progression-free survival and the evolution of these specific mutations during subsequent cetuximab treatment. This
result suggests that chemotherapy mutagenesis can accelerate resistance evolution. Mutational signatures may be a new class
of cancer evolution predictor.
T
he anti-EGFR antibody (EGFR-AB) cetuximab is active
against many KRAS/NRAS wild-type metastatic colorectal
cancers (CRCs)1,2. However, resistance invariably evolves
within several months. Darwinian selection of subclones that harbour mutations in KRAS, NRAS and EGFR is among the commonest mechanisms of acquired resistance3–6. Pre-treatment biomarkers
that can predict the time to resistance evolution and the specific
resistance mechanism that will evolve have not been identified7,8.
Mutation generation is central to resistance evolution, and
mutational signature analysis can be used to dissect cancer mutational processes9,10. Yet, how the activity of specific mutational
signatures enables or constrains the evolution of cetuximab resistance in CRCs is unknown. Resistance evolution may furthermore
be influenced by the timing of specific mutational processes. The
pre-existing drug resistance model assumes that such mutations
are already present in small subclones before EGFR-AB exposure,
making the evolution of acquired resistance inevitable (Fig. 1a)11.
Recently, a model of ‘adaptive mutagenesis’ has been proposed in
which cetuximab treatment triggers a transient downregulation of
mismatch repair (MMR) and homologous recombination (HR)
DNA repair proteins and increased expression of low-fidelity DNA
polymerases, which together promote mutation generation in CRC
cells12. Such drug-induced mutagenesis could increase the probability of resistance mutation acquisition during treatment (Fig. 1a).
Importantly, these are preclinical observations, and it is unknown
how prevalent cetuximab-induced mutagenesis is in patients13 and
whether it impacts the acquisition of common resistance mutations. More generally, it remains undetermined whether any specific mutational signatures change through cetuximab treatment
and which signatures generate the majority of resistance mutations
in the clinic.
Our aim was to assess the activity of mutational mechanisms
in serial biopsies from KRAS/NRAS wild-type CRC patients who
were treated with single-agent cetuximab in a clinical trial. Drug
treatment forces the cancer cell population through an evolutionary bottleneck7. We reasoned that this should reveal the mutational
signatures operating before or during treatment, as these become
increasingly clonal and hence detectable by exome sequencing.
Cetuximab-induced mutagenesis should increase both mutation
loads and the specific mutational signatures that are characteristic
of these mechanisms in patients who benefit (Fig. 1a). In contrast,
no changes would be expected in patients with primary progression where cetuximab lacks activity. We further assessed which
mutational mechanisms are most relevant for the generation of the
hotspot driver mutations that evolve at acquired resistance.
Results
Clinical trial samples. The patient characteristics and biopsy analysis of the Prospect-C phase II trial have been described previously3.
Biopsies had been taken at baseline (BL) before cetuximab initiation
and at progressive disease (PD) from KRAS/NRAS wild-type CRCs.
Paired BL/PD biopsies from 21 patients were successfully analysed
by exome sequencing and had sufficient cancer cell content for bioinformatics analysis (Extended Data Fig. 1a; see Methods for the
full details). The characteristics of these patients were comparable
to those of the entire population in the Prospect-C trial and in other
EGFR-AB trials (Supplementary Table 1). The median sequencing
depth of BL (112×) and PD (148×) samples and the median cancer cell content of BL (40%) and PD (44%) samples were similar.
Neither sequencing depth nor cancer cell content of samples correlated with the mutation load (Extended Data Fig. 1b,c). There
was hence no evidence that sequencing depth or cancer cell content
Translational Oncogenomics Laboratory, The Institute of Cancer Research, London, UK. 2Institute for Research in Biomedicine (IRB Barcelona), The
Barcelona Institute of Science and Technology, Barcelona, Spain. 3Research Program on Biomedical Informatics, Universitat Pompeu Fabra, Barcelona,
Spain. 4Institució Catalana de Recerca i Estudis Avanỗats (ICREA), Barcelona, Spain. 5Tumour Profiling Unit, The Institute of Cancer Research, London, UK.
6
Gastrointestinal Cancer Unit, The Royal Marsden Hospital, London, UK. ✉e-mail:
1
Nature Ecology & Evolution | www.nature.com/natecolevol
Articles
biased the number of detected mutations in BL versus PD samples.
No tumour showed MMR deficiency at BL3. Progression at or before
the first per-protocol CT scan (scheduled at 12 weeks) had been
classified as ‘primary progression’ (n = 9). The remaining tumours
were considered to have obtained ‘prolonged benefit’ (n = 12)
from treatment3.
Temporal change of mutation loads. Mutation trees were generated to analyse the evolutionary relationships of cancer cells in BL
and PD biopsies and changes in the mutation load (Fig. 1b). The
trunk represents mutations present in both samples, whereas the
branches indicate mutations unique to BL or PD samples. Truncal
mutation loads were similar between tumours with prolonged benefit and those with primary progression (P = 0.53, t-test). Cancers
with prolonged benefit had higher unique mutation numbers
compared with primary progressors (mean sum of BL and PD, 113
and 73, respectively; P = 0.06; t-test). Although this result was not
significant, it probably indicates a cetuximab-induced population
bottleneck that diminishes treatment-sensitive subclones, which
are replaced by subclones with distinct mutations at acquired
resistance, whereas subclones at BL and PD are more similar in
primary progressors.
The number of unique mutations did not significantly change
from BL to PD in either group (prolonged benefit, P = 0.74; primary
progression, P = 0.62; paired t-test). An increase in the number of
small insertions and deletions (INDELs) can be an indicator of
acquired MMR deficiency14, but these did not change significantly
from BL to PD (prolonged benefit, P = 0.71; primary progression,
P = 0.13; paired t-test; Fig. 1c). The absence of a population bottleneck in primary progressors is a potential source of bias, as these
tumours may harbour higher numbers of subclones at PD, leading
to higher subclonal mutation loads than in prolonged benefit cases
where subclones were pruned. We therefore repeated the analysis
by considering only clonal mutations in each sample. This analysis found no significant increase in mutations in tumours with
prolonged benefit (P = 0.66, Extended Data Fig. 2) or in primary
progressors (P = 0.20, paired t-test). As mutations accumulate over
time, we tested whether the time lapse between BL and PD may
influence branch lengths. We found no association between treatment duration and the number of unique mutations (Spearman’s
r = 0.23, P = 0.31, Extended Data Fig. 3). We further considered that
cetuximab-induced mutagenesis may be active in only a subgroup of
tumours. At PD, 6/12 (50%) of cases with prolonged benefit showed
an increase in the unique mutation load, but so did 4/9 (44.4%) of
tumours with primary progression (Fig. 1d). Thus, although mutations can increase in individual tumours after treatment, this fraction did not differ between these groups.
Taken together, we found no evidence for a rise in the mutation
load through cetuximab treatment. This mirrors results from Russo
et al.12, who described only a negligible change in mutation burden
in cetuximab-treated CRC cell lines analysed by exome sequencing.
Exome sequencing analyses only ~1–2% of the genome, which may
NATuRE EColoGy & EvoluTIon
be insufficient to detect an increase in mutations across the genome.
However, these results show that if drug-induced mutagenesis
is active, the impact on the mutation load in the protein-coding
genome is small.
Microsatellite tract length variability. Cetuximab-induced mutagenesis increased the accumulation of INDELs in microsatellite
tracts in CRC cell lines12. Assessing the length variability of microsatellites showed no increase from BL to PD in tumours with prolonged benefit or with primary progression (Fig. 1e). Restricting
the analysis to those tumours with an increase in the unique
mutation load at PD also showed no change. We hence found no
evidence for a cetuximab-induced increase in microsatellite tract
length variability.
Temporal change of mutational signatures. Mutational signature
analysis9 should reveal changes in the activity of mutagenic processes independent of mutation loads. All single nucleotide substitutions and the two flanking bases were analysed, corresponding
to 96 trinucleotide sequence motifs. Individual trinucleotide motifs
showed only small changes from BL to PD without obvious differences between tumours with prolonged benefit and those with
primary progression (Fig. 2a). We next assigned these mutations to
individual mutational signatures15. To limit the impact of signature
bleeding, which can lead to the misassignment of mutations to signatures with high similarity16, we included only (1) signatures that
were detectable in a large series of CRC samples (Extended Data Fig.
4; SBS1, SBS5 and SBS40, which are clock-like on the basis of their
relatively constant rate over time17; SBS15, which is typical for CRCs
with MMR deficiency18; SBS17b, which can be present in CRCs
that were treated with 5-fluorouracil (5-FU) chemotherapy19,20; and
SBS17a, which remains of uncertain aetiology, although oxidative
damage has been suggested to contribute to SBS17a/SBS17b21), (2)
additional signatures of mutational processes that were reported to
increase through cetuximab-induced mutagenesis by Russo et al.12
(HR-deficiency signature SBS3 and MMR-deficiency signature
SBS6; refs. 9,22) and (3) the platinum chemotherapy signature SBS35,
as all tumours had received chemotherapy.
SBS1 and signatures with a broad range of substitution motifs
(SBS5 and SBS40) were the most abundant (Fig. 2b,c). The platinum signature SBS35 and the 5-FU-associated signature SBS17b,
which is characterized by a unique predominance of T>G mutations in a CTT context, were the next most abundant. SBS1, SBS5
and SBS40 were active in most samples, whereas SBS35 and SBS17b
were detected in only a subset.
We investigated whether any of the signatures increased with
cetuximab treatment in the prolonged benefit group. SBS1 and SBS5
both showed small (1%) increases from BL to PD (Fig. 2c). The
HR-deficiency signature SBS3 also showed a 1% increase, but this
was driven by a single case (C1005, Fig. 2b). Focusing only on the
six tumours in the prolonged-benefit group that showed an increase
in the unique mutation load revealed the largest rise for SBS17a
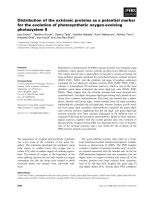
Fig. 1 | Cetuximab resistance models and analysis of mutation loads in 21 tumours treated with single-agent cetuximab. a, Models of primary and
acquired cetuximab resistance and their relationship to mutation signature activity. b, Mutation trees for 21 tumours from the Prospect-C trial. The
tumours are grouped into cases with prolonged benefit and those with primary progression. In each tree, the trunk represents mutations present in both BL
and PD samples, whereas the branches indicate mutations unique to BL or PD samples. The numbers next to the trunks and branches indicate the number
of somatic mutations. Cetuximab resistance driver mutations and copy number aberrations (CNA) identified in ref. 3 are shown below the trees. The
RECIST change indicates the change of the sum of radiological tumour measurements on the basis of RECIST criteria from BL to the time of best response.
c, Change of the unique INDEL numbers from BL to PD. The coloured lines show the means. The P values were calculated with paired t-tests. d, Unique
mutation loads for each tumour at BL versus PD. The dashed lines indicate a relative increase or decrease by 10%, 20% or 30%. e, Microsatellite length
variability analysis with the MSIsensor algorithm. MSI-scores indicate the percentage of microsatellite and homopolymer loci with an increased read
length variability at PD compared with BL. The horizontal bars show the mean MSI-score for each group. The MSI-score of the only MMR-deficient tumour
from the Prospect-C trial (which has not been included in any other analyses, as no paired PD sample was available) in comparison with the matched
blood sample is shown as a control for correct MSI detection.
Nature Ecology & Evolution | www.nature.com/natecolevol
Articles
NATuRE EColoGy & EvoluTIon
at PD, and a single case (C1004) showed a relatively large increase
in SBS17a and SBS17b. Thus, neither SBS17a nor SBS17b seems to
be specifically promoted by cetuximab.
and SBS17b (+2% each, Fig. 2d,e), but this was driven by a single
tumour (C1020, Fig. 2b). SBS17b also rose by 2% among the four
tumours with primary progression that showed a mutation increase
a
Primary resistance model
Pre-existing resistance model
EGFR-AB treatment
Drug-induced resistance model
EGFR-AB treatment
EGFR-AB treatment
Background CRC mutagenesis
Normal Tumour
cell
cell
Drug-induced
mutagenesis
Background CRC mutagenesis
Background CRC mutagenesis
General mutational processes
General mutational processes
b
Resistant
cancer cells
Normal Tumour
cell
cell
Bottleneck
Normal Tumour
cell
cell
Bottleneck
Resistant
cancer cells
Acquisition of
resistance driver
Resistant
cancer cells
Time
General mutational processes
Trunk
Tumours with prolonged benefit (n = 12)
42
31
101
99
56
PD only
180
98 50
10
11
56
124
210
BL only
125
57
147
82
124
159
48
109
68
54
96
155
95
58
55
132
KRAS
Q61H
FGF10
AMP
KRAS
AMP
10
88
24
22
EGFR
S492R
KRAS
G12C
Point mutation
CNA
68
73
69
25
103
47
Average
37
0
RECIST
–20
change
–40
–60
C1026
C1007
C1024
C1005
C1037
C1020
C1014
C1027
C1044
C1025
C1018
C1030
Tumours with primary progression (n = 9)
35
46
89
28
5
146
5 5
156
38
134
272
NF1
L252fs
Point mutation
CNA
25
47
21
35
62
4
111
140
BRAF
V600E
125
40
18
13
93
130
BRAF
V600E
KRAS
A18D
NF1
E2448X
C1047
C1033
C1045
39
Average
104
73
145
100
mutations
ERBB2
AMP
C1004
C1021
C1006
C1043
C1022
C1029
d
c
6
6
P = 0.71
P = 0.13
5
Unique INDELs
Unique INDELs
5
4
3
2
4
3
2
1
1
0
0
BL
PD
Prolonged benefit
Primary progressor
Mean
150
Primary progressor (n = 9)
Mutations unique to PD
Prolonged benefit (n = 12)
+3
0
+2 %
0%
40
RECIST
20
change
0
100
55
50
39
0
BL
PD
0
35 50 58
100
Mutations unique to BL
e
MSI control
All tumours
Tumours with an increase
in mutation load at PD
MSI-score (%)
35.00
0.06
0.04
0.02
0
Tumours with
primary progression
Nature Ecology & Evolution | www.nature.com/natecolevol
e
0% ng
+1 cha 10%
– %
o
N
0
–2 %
0
–3
Tumours with
prolonged benefit
Tumours with
primary progression
Tumours with
prolonged benefit
150
Articles
a
NATuRE EColoGy & EvoluTIon
Tumours with primary progression
Tumours with prolonged benefit
BL
8
8
4
4
0
PD
12
8
4
0
PD minus BL
4
BL
12
Mutation probability (%)
0
PD
12
8
4
0
PD minus BL
4
PD
PD
0
0
BL
BL
A.A
A.C
A.G
A.T
C.A
C.C
C.G
C.T
G.A
G.C
G.G
G.T
T.A
T.C
T.G
T.T
A.A
A.C
A.G
A.T
C.A
C.C
C.G
C.T
G.A
G.C
G.G
G.T
T.A
T.C
T.G
T.T
A.A
A.C
A.G
A.T
C.A
C.C
C.G
C.T
G.A
G.C
G.G
G.T
T.A
T.C
T.G
T.T
A.A
A.C
A.G
A.T
C.A
C.C
C.G
C.T
G.A
G.C
G.G
G.T
T.A
T.C
T.G
T.T
A.A
A.C
A.G
A.T
C.A
C.C
C.G
C.T
G.A
G.C
G.G
G.T
T.A
T.C
T.G
T.T
A.A
A.C
A.G
A.T
C.A
C.C
C.G
C.T
G.A
G.C
G.G
G.T
T.A
T.C
T.G
T.T
–4
A.A
A.C
A.G
A.T
C.A
C.C
C.G
C.T
G.A
G.C
G.G
G.T
T.A
T.C
T.G
T.T
A.A
A.C
A.G
A.T
C.A
C.C
C.G
C.T
G.A
G.C
G.G
G.T
T.A
T.C
T.G
T.T
A.A
A.C
A.G
A.T
C.A
C.C
C.G
C.T
G.A
G.C
G.G
G.T
T.A
T.C
T.G
T.T
A.A
A.C
A.G
A.T
C.A
C.C
C.G
C.T
G.A
G.C
G.G
G.T
T.A
T.C
T.G
T.T
A.A
A.C
A.G
A.T
C.A
C.C
C.G
C.T
G.A
G.C
G.G
G.T
T.A
T.C
T.G
T.T
A.A
A.C
A.G
A.T
C.A
C.C
C.G
C.T
G.A
G.C
G.G
G.T
T.A
T.C
T.G
T.T
–4
CC->>GG
>T
CC->
T>A
T>C
T>G
CC->> AA
CC->>GG
b
Tumours with prolonged benefit
Proportion of samples with
signature contribution
100
Unexplained variance
60
40
20
SBS40
92%
SBS35
75%
SBS17b
67%
SBS17a
50%
SBS15
67%
SBS6
58%
SBS5
92%
SBS3
8%
SBS1
100%
Proportion of samples with
signature contribution
40
SBS40
89%
SBS35
56%
SBS17b
67%
SBS17a
22%
SBS15
44%
SBS6
44%
SBS5
100%
SBS3
44%
SBS1
100%
8
4
4
Mutation probability (%)
8
0
PD
SBS40
8
4
0
PD minus BL
PD
A.A
A.C
A.G
A.T
C.A
C.C
C.G
C.T
G.A
G.C
G.G
G.T
T.A
T.C
T.G
T.T
A.A
A.C
A.G
A.T
C.A
C.C
C.G
C.T
G.A
G.C
G.G
G.T
T.A
T.C
T.G
T.T
A.A
A.C
A.G
A.T
C.A
C.C
C.G
C.T
G.A
G.C
G.G
G.T
T.A
T.C
T.G
T.T
A.A
A.C
A.G
A.T
C.A
C.C
C.G
C.T
G.A
G.C
G.G
G.T
T.A
T.C
T.G
T.T
A.A
A.C
A.G
A.T
C.A
C.C
C.G
C.T
G.A
G.C
G.G
G.T
T.A
T.C
T.G
T.T
A.A
A.C
A.G
A.T
C.A
C.C
C.G
C.T
G.A
G.C
G.G
G.T
T.A
T.C
T.G
T.T
>T
CC->
T>A
T>C
T>G
+1%
40
SBS35
SBS17b
SBS17a
SBS15
SBS6
–2%
+1%
–2%
SBS5
SBS3
+1%
+1%
+1%
e
SBS1
Tumours with an increase in unique
mutations at PD
Unexplained variance
100
Tumours with
prolonged
benefit
BL
PD
BL
Tumours with
primary
progression
BL
PD
+5%
–2%
80
PD
8
4
0
4
–2%
0
Number of
2,163 2,129 1,530 1,575
mutations:
PD minus BL
PD
60
+1%
+2%
+2%
–1%
+1%
+1%
+1%
+2%
–3%
–4%
40
Unexplained
variance
SBS40
SBS35
SBS17b
SBS17a
SBS15
SBS5
–1%
SBS3
–1%
SBS1
BL
–4
20
A.A
A.C
A.G
A.T
C.A
C.C
C.G
C.T
G.A
G.C
G.G
G.T
T.A
T.C
T.G
T.T
A.A
A.C
A.G
A.T
C.A
C.C
C.G
C.T
G.A
G.C
G.G
G.T
T.A
T.C
T.G
T.T
A.A
A.C
A.G
A.T
C.A
C.C
C.G
C.T
G.A
G.C
G.G
G.T
T.A
T.C
T.G
T.T
A.A
A.C
A.G
A.T
C.A
C.C
C.G
C.T
G.A
G.C
G.G
G.T
T.A
T.C
T.G
T.T
A.A
A.C
A.G
A.T
C.A
C.C
C.G
C.T
G.A
G.C
G.G
G.T
T.A
T.C
T.G
T.T
A.A
A.C
A.G
A.T
C.A
C.C
C.G
C.T
G.A
G.C
G.G
G.T
T.A
T.C
T.G
T.T
BL
60
20
0
0
–4
–1%
0
12
Unexplained
variance
+2%
Tumours with primary progression and an increase
in mutation burden at PD
12
CC->>GG
100
80
Tumours with an increase in unique
mutations at PD
SBS 15
Defective MMR
SBS 6
Defective MMR
SBS 40
Unknown aetiology
Tumours with prolonged benefit and an increase
in mutation burden at PD
BL
CC->> AA
Tumours with Tumours with
primary
prolonged
progression
benefit
BL
PD BL
PD
Unexplained variance
0
d
Mutation probability (%)
C1021 C1006 C1022 C1047 C1045 C1004 C1043 C1029 C1033
BL PD BL PD BL PD BL PD BL PD BL PD BL PD BL PD BL PD
20
Tumours with an increase in unique
mutations at PD
SBS 1
SBS 5
SBS 3
Deamination of 5-methylcytosine
Unknown aetiology
Defective HR
SBS 17a
SBS 17b
SBS 35
Unknown aetiology
Unknown aetiology/5FU
Platinum chemotherapy
4
T>G
c
60
0
12
T>C
80
Mutation probability (%)
Mutation probability (%)
80
12
T>A
Tumours with primary progression
C1007 C1005 C1037 C1014 C1027 C1044 C1026 C1024 C1020 C1025 C1018 C1030
BLPD BLPD BLPD BLPD BLPD BLPD BLPD BLPD BLPD BLPD BLPD BLPD
100
>T
CC->
Trinucleotide sequence motifs
Trinucleotide sequence motifs
Mutation probability (%)
CC->> AA
Mutation probability (%)
Mutation probability (%)
12
CC->> AA
Trinucleotide sequence motifs
CC->>GG
>T
CC->
T>A
Trinucleotide sequence motifs
T>C
–2%
T>G
0
Number of
778
mutations:
900
740
850
Fig. 2 | Mutational signatures in tumours treated with cetuximab. a, 96-trinucleotide-motif plot of all single base substitutions (SBSs) prior to cetuximab
treatment (BL) and at progression (PD). The bottom panel shows the difference between BL and PD. b, Attribution of SBSs to mutational signatures shows
the contribution of each signature to individual samples at BL and PD. c, Signature contribution for the combined group of cases with prolonged benefit
or primary progression. d, Mutational signatures in tumours where an increase in the unique mutation burden was found at PD. e, Mutational signature
contribution for the combined group of cases with prolonged benefit or primary progression that also showed an increase in the unique mutation burden.
To ascertain our results, we repeated the mutational signature analysis with a second, independent method, which applies a
non-negative least-squares approach to signature fitting23 instead of
the iterative linear regression method24 used for Fig. 2. Signature
SBS40 was more and SBS5 less abundant with this approach. All
other signatures showed a high level of agreement (Extended Data
Fig. 5a). A comparison of signature abundance at BL and PD in
cases with prolonged benefit versus those with primary progression (Extended Data Fig. 5b) supported the same conclusions as the
analysis in Fig. 2.
Taken together, no signature noticeably increased at PD in the
prolonged-benefit group despite a median cetuximab treatment
duration of 26 weeks (range, 18–96 weeks). Signatures that would
be expected to increase most strongly through cetuximab-induced
mutagenesis in the prolonged-benefit group showed only a 1%
increase, which was driven by a single case (SBS3, HR deficiency);
remained unchanged (SBS15, MMR deficiency); or even decreased
(SBS6, MMR deficiency). These results are inconsistent with a
major contribution of drug-induced mutagenesis to exonic mutations in CRC patients.
SBS17b disproportionally contributes to driver mutations
enriched at acquired resistance. KRAS/NRAS and EGFR mutations
are the commonest genetic mechanisms of acquired cetuximab
Nature Ecology & Evolution | www.nature.com/natecolevol
Articles
NATuRE EColoGy & EvoluTIon
SBS1, deamination of
5-methylcytosine
SBS17a,
unknown aetiology
Normalized signature
contribution (%)
D C
T A
Reference context
CACCA
Reference protein
G12
SBS15: defective MMR
SBS17a: unknown aetiology
C ACC T
Q61
G12
0
C>A
C>T
1.11-fold
more Q61H
40
20
C>
C ->
GG
CC
->>TT
T>A
T>C
T>G
A.A
A.C
A.G
A.T
C.A
C.C
C.G
C.T
G.A
G.C
G.G
G.T
T.A
T.C
T.G
T.T
A.A
A.C
A.G
A.T
C.A
C.C
C.G
C.T
G.A
G.C
G.G
G.T
T.A
T.C
T.G
T.T
A.A
A.C
A.G
A.T
C.A
C.C
C.G
C.T
G.A
G.C
G.G
G.T
T.A
T.C
T.G
T.T
A.A
A.C
A.G
A.T
C.A
C.C
C.G
C.T
G.A
G.C
G.G
G.T
T.A
T.C
T.G
T.T
A.A
A.C
A.G
A.T
C.A
C.C
C.G
C.T
G.A
G.C
G.G
G.T
T.A
T.C
T.G
T.T
A.A
A.C
A.G
A.T
C.A
C.C
C.G
C.T
G.A
G.C
G.G
G.T
T.A
T.C
T.G
T.T
C>
C ->
AA
Trinucleotide sequence motifs
T>G
SBS1, SBS3, SBS5, SBS6, SBS15, SBS40
SBS17b
SBS17b
SBS35
SBS35
30
25
20
15
10
5
0
C>A
C>G
KRAS/NRAS Q61R
KRAS/NRAS Q61L
80
60
40
20
0
L
RE
R
R
N
S
T
A A
C
A
C
T
Reference context
T TCAG
AGG A A
AAGCA
Reference protein
S464
G465
S492
Gene
EGFR P794S
SBS40: unknown aetiology
T>C
Variant nucleotide
Variant protein
EGFR K714N
g
T>A
100
1.29-fold
fewer Q61H
SBS17b: unknown aetiology/5FU
SBS35: platinum chemotherapy
Q61
f
5.59-fold
fewer Q61H
80
0
Signature
inclusion
CT TG T
G13
Trinucleotide sequence motifs
10.45-fold
fewer Q61H
60
NRAS G12S
KRAS G13D
KRAS G12D
C>G
KRAS/NRAS Q61H
5
KRAS G12S
KRAS G12A
10
KRAS G12R
15
CACCA
NRAS
25
20
LR K
H
AG AC T
C>T
AAAGA GCCCT
K714
P794
EGFR
T>A
T>C
T>G
A.A
A.C
A.G
A.T
C.A
C.C
C.G
C.T
G.A
G.C
G.G
G.T
T.A
T.C
T.G
T.T
A.A
A.C
A.G
A.T
C.A
C.C
C.G
C.T
G.A
G.C
G.G
G.T
T.A
T.C
T.G
T.T
A.A
A.C
A.G
A.T
C.A
C.C
C.G
C.T
G.A
G.C
G.G
G.T
T.A
T.C
T.G
T.T
A.A
A.C
A.G
A.T
C.A
C.C
C.G
C.T
G.A
G.C
G.G
G.T
T.A
T.C
T.G
T.T
A.A
A.C
A.G
A.T
C.A
C.C
C.G
C.T
G.A
G.C
G.G
G.T
T.A
T.C
T.G
T.T
A.A
A.C
A.G
A.T
C.A
C.C
C.G
C.T
G.A
G.C
G.G
G.T
T.A
T.C
T.G
T.T
8
4
0
30
20
10
0
C T TGA
G13
KRAS
EGFR S464L
EGFR G465E
SBS6: defective MMR
CGCC A
EGFR G465R
SBS5: unknown aetiology
20
0
60
40
20
0
100
D R
T G
Normalized
signature
contribution (%)
e
SBS3: defective HR
DVA SC
T AG T A
EGFR S492R
SBS1: deamination of
5-methylcytosine
Percentage of
mutations generated (%)
Mutation probability (%)
COSMIC reference signature profiles
H
A.A
A.C
A.G
A.T
C.A
C.C
C.G
C.T
G.A
G.C
G.G
G.T
T.A
T.C
T.G
T.T
A.A
A.C
A.G
A.T
C.A
C.C
C.G
C.T
G.A
G.C
G.G
G.T
T.A
T.C
T.G
T.T
A.A
A.C
A.G
A.T
C.A
C.C
C.G
C.T
G.A
G.C
G.G
G.T
T.A
T.C
T.G
T.T
A.A
A.C
A.G
A.T
C.A
C.C
C.G
C.T
G.A
G.C
G.G
G.T
T.A
T.C
T.G
T.T
A.A
A.C
A.G
A.T
C.A
C.C
C.G
C.T
G.A
G.C
G.G
G.T
T.A
T.C
T.G
T.T
A.A
A.C
A.G
A.T
C.A
C.C
C.G
C.T
G.A
G.C
G.G
G.T
T.A
T.C
T.G
T.T
Signature contribution to
KRAS/NRAS hotspot mutations (%)
–20
LRP EK
A G A CG C T
KRAS/NRAS Q61H
Gene
–10
30
20
10
0
3
2
1
0
4
2
0
30
20
10
0
40
20
0
40
0
VAD CRS
0
b
20
AGT AGT
10
Unexplained variance
40
Variant nucleotide
d
20
SBS15,
defective MMR
60
KRAS Q61E
KRAS/NRAS Q61H
Difference between mutation distributions of
treatment-naive CRC and tumours with acquired resistance
SBS6,
defective MMR
SBS40,
unknown aetiology
80
Variant protein
KRAS/NRAS Q61R
KRAS/NRAS Q61L
KRAS/NRAS Q61H
NRAS G12S
KRAS G13D
KRAS G12S
0
KRAS G12D
KRAS Q61E
KRAS G12R
10
KRAS G12A
20
NRAS Q61K
KRAS G12V
30
KRAS G12C
KRAS/NRAS mutation distribution at acquired resistance
(Woolston et al.: 11 cases, Bettegowda et al.: 24 cases)
SBS5,
unknown aetiology
SBS35,
platinum chemotherapy
SBS3,
defective HR
SBS17b,
unknown aetiology/5FU
100
NRAS Q61K
KRAS G12V
KRAS G12C
KRAS/NRAS Q61H
KRAS/NRAS Q61R
KRAS/NRAS Q61L
KRAS Q61H
KRAS G13D
KRAS G12S
KRAS/NRAS G12A
KRAS G12R/
NRAS G13R
KRAS Q61E
KRAS/NRAS G12D
/NRAS G13D
0
KRAS Q61K
NRAS Q61K
10
KRAS G12C/G13C
NRAS G12C
20
KRAS/NRAS G12V
30
c
KRAS Q61P
KRAS
NRAS
KRAS/NRAS mutation distribution in
treatment-naive CRC (218 cases)
Signature contribution to
EGFR hotspot mutations (%)
Difference in
mutation probability (%)
Mutation probability (%)
Mutation probability (%)
a
Trinucleotide sequence motifs
Fig. 3 | Relationship of mutational signatures to specific KRAS/NRAS and EGFR mutations. a, KRAS/NRAS codon 12/13/61 mutation frequency in
treatment-naive CRCs from the Cancer Genome Atlas (TCGA) Pan-Cancer study versus those identified in CRCs with acquired EGFR-AB resistance3,5,26. b,
SigProfiler exome SBS reference profiles (syn11967914.3) of all active signatures included in the analyses of the Prospect-C cohort. c, Relative contribution of
each of the signatures in b corresponding to the indicated KRAS/NRAS mutations when an equal number of mutations is generated with each signature. All
reference contexts in the figure show the main genomic strand. d, Modelling of the relative contribution of each of the signatures in b to all indicated KRAS/
NRAS mutations when the observed mutational signature distribution at BL in cases with prolonged benefit is taken into account. e, Modelled contributions
of chemotherapy-related mutation signatures (SBS17b and SBS35) to KRAS/NRAS Q61H mutations versus all other hotspot mutations. The results
presented are from a model that assumes a 10× acceleration in mutation accumulation of signatures SBS1, SBS3, SBS5, SBS6, SBS15 and SBS40 between
diagnosis and BL biopsy. f, Repeat of the analysis in c for EGFR mutations. g, Repeat of the analysis in d for EGFR mutations.
resistance in CRC3–6. Mutations in these genes at acquired resistance
differ from those in treatment-naive CRCs: EGFR mutations at
acquired resistance disrupt cetuximab binding epitopes and do not
occur in untreated CRCs, as they provide no fitness advantage in the
absence of treatment25. Furthermore, comparing biopsy sequencing
and circulating tumour DNA (ctDNA) sequencing results of CRCs
with acquired cetuximab resistance3,5,26 against biopsy sequencing
data of KRAS/NRAS mutant treatment-naive CRCs27 showed that
KRAS/NRAS codon 12/13 mutations were 1.7-fold lower and codon
61 mutations 4.2-fold higher in tumours with acquired resistance
compared with tumours with expected primary resistance. Q61H
mutations showed the largest increase (11.8-fold, Fig. 3a). Analysis
of the CORRECT trial28 even showed a 21.1-fold increase of KRAS
Q61H mutations at acquired cetuximab resistance compared with
treatment-naive KRAS mutant CRCs (Extended Data Fig. 6).
Motivated by the observation that signature contributions varied
between tumours in the Prospect-C trial, we questioned whether
signature activity before cetuximab initiation influences which
resistance driver mutations evolve at acquired resistance.
We first compared KRAS/NRAS mutation profiles in CRC (Fig.
3a) with the published15 mutational signature profiles (Fig. 3b).
SBS3, SBS5 and SBS40 overlapped with most hotspot mutations.
The remaining signatures overlapped with only a few KRAS/NRAS
Nature Ecology & Evolution | www.nature.com/natecolevol
mutations, indicating that the activity of these signatures could
influence the probability that specific mutations are generated and
thereby account for genetically distinct evolutionary outcomes.
We hence calculated the probability for each signature to generate specific KRAS/NRAS mutations (Fig. 3c). Intriguingly, SBS17b
showed a strong preference to create KRAS/NRAS Q61H mutations
and almost exclusively generated the T>G mutation that was most
enriched at acquired cetuximab resistance. The platinum signature SBS35 also overlapped with a KRAS/NRAS Q61H mutation
(T>A) that is enriched at acquired resistance. SBS17b and SBS35
activity could thus critically influence the probability that these
mutations evolve.
We therefore modelled the KRAS/NRAS mutation distribution that would be generated in prolonged-benefit cases on the
basis of the observed signature contribution at BL (Supplementary
Table 2 and Extended Data Fig. 7a). Despite the higher activity of
SBS1, SBS5 and SBS40 (together accounting for 70% of mutations,
Fig. 2c), SBS17b was the largest contributor of KRAS/NRAS Q61H
mutations (65% of all Q61H mutations, Fig. 3d). SBS35 generated
the second highest proportion of Q61H mutations (13% of all Q61H
mutations), although it contributed more codon 12 mutations than
codon 61 mutations. Codon 12 and codon 13 mutations were most
likely to be generated by the clock-like signatures SBS5 and SBS40.
Articles
NATuRE EColoGy & EvoluTIon
a
b
P = 0.002
Tumours with prolonged benefit (n = 11)
100
* Original estimate
15
10
*
75
0
*
*
*
*
*
25
0
0
*
Mutations
preferentially
generated by
SBS35
G13D
G12D
G12V
Q61K
20
25
75
P = 0.829
50
25
C1025
C1037
C1044
C1027
G465R S464L
C1018
C1026
S464L
G465E
C1005
C1024
C1041
C1038
EGFR
G12C
Q61K
Q61K
S464L D278N
G465E
10
15
Time (months)
100
Survival probability (%)
KRAS
Q61H
(T>A)
G12C
5
Tumours with primary progression (n = 9)
KRAS EGFR KRAS NRAS KRAS
Q61H S492R Q61H Q61H Q61H
(T>G) (A>C) (T>G) (T>G) (T>G)
KRAS
Mutations
preferentially
generated by
other
NRAS
signatures
P = 0.028
50
*
Mutations
preferentially
generated by
SBS17b
BL SBS17b detected
BL SBS17b not detected
*
*
5
*
Survival probability (%)
20
C1030
Proportion of BL mutations assigned to SBS17b (%)
25
0
0
1
2
3
Time (months)
4
5
Fig. 4 | Association of detected SBS17b at BL with specific KRAS/NRAS and EGFR mutation evolution at the time of acquired resistance and with PFS.
a, SBS17b signature contribution calculated from whole-exome mutation analysis of BL biopsies for all prolonged-benefit cases with available ctDNA
sequencing versus resistance driver mutations in KRAS/NRAS and EGFR that were detected at PD in ctDNA. The stability of the SBS17b attributions was
assessed by bootstrap analysis on the basis of 1,000 replicates. Signature decomposition was then calculated for each replicate, and the 25th, 50th and
75th percentiles are presented. Statistical significance was assessed with Fisher’s exact test. b, Kaplan–Meier analysis of PFS for tumours with and without a
detected SBS17b contribution at BL. Statistical significance was assessed with the log-rank test.
To further substantiate whether the chemotherapy-induced signatures SBS17b (5-FU) and SBS35 (platinum) can explain the strong
enrichment of Q61H mutations among KRAS/NRAS mutations at
acquired cetuximab resistance (Extended Data Fig. 7b), we modelled the distributions of KRAS/NRAS codon 12, 13 and 61 mutations that would be expected in the presence or absence of these
signatures. Tumours harbour higher numbers of mutations corresponding to the clock-like signatures (SBS1, SBS5 and SBS40) than
to SBS17b and SBS35, but the former are active over the lifetime of
the patient, whereas the chemotherapy-induced signatures SBS17b
and SBS35 are acquired over a much shorter period. In addition,
even signatures that are active over the patient’s lifetime can accelerate up to about tenfold once a cancer is established due to increased
proliferation and genomic instability29. The signature composition
we observe at BL thus may not be reflective of the true activity of
the signatures at the biopsy time point. We therefore estimated the
contemporaneous activity of each mutational signature by taking
into account the period over which it is probably active and a range
of acceleration rates.
Our model assumes that SBS1, SBS5 and SBS40 have a constant
mutation rate from birth until diagnosis (median, 68.4 yr) followed
by a period of acceleration from the time of diagnosis to biopsy
(median, 2.7 yr; Extended Data Fig. 7c). Chemotherapy-induced
signatures (SBS17b and SBS35) were assumed active only after cancer diagnosis. The temporal variability of SBS3, SBS6, SBS15 and
SBS17a is poorly understood, but they are not known to increase
through chemotherapy treatment. They were therefore modelled
analogously to SBS1, SBS5 and SBS40.
The model shows that in the absence of SBS17b and SBS35,
KRAS/NRAS Q61H mutations are generated with a 10.45-fold lower
probability than all other KRAS/NRAS 12/13/61 hotspot mutations
taken together (Fig. 3e). The likelihood of generating a Q61H mutation increases when the platinum signature SBS35 is added, but
it still remains 5.59-fold lower than all other hotspot mutations.
However, when the SBS17b signature is added in the model, Q61H
becomes the predominant KRAS/NRAS mutation (1.11-fold higher
probability than all other KRAS/NRAS mutations taken together).
When both signatures are added together, Q61H mutations are
1.29-fold lower than all other hotspot mutations. The slightly lower
enrichment is explained by the generation of additional codon 12/13
mutations by SBS35. Our simplified model hence demonstrates that
SBS17b signature activity and to a smaller extent SBS35 are able to
explain the inflated frequency of KRAS/NRAS Q61H mutations at
acquired cetuximab resistance (Extended Data Fig. 7b).
Nature Ecology & Evolution | www.nature.com/natecolevol
Articles
NATuRE EColoGy & EvoluTIon
We next varied several model assumptions to assess whether
this would change these conclusions. First, the tumour is likely to
be present several months to years prior to diagnosis. We therefore
considered an extended period of tumour growth (twice the time
from diagnosis, 5.4 yr). Second, it is unclear whether SBS3, SBS6,
SBS15 and SBS17a are acquired over the patient’s lifetime. We hence
assessed whether restricting their activity to only the growth phase
(equivalent to SBS17b and SBS35 modelling) impacts the results.
We finally tested additional acceleration factors (1× and 5×). All
models showed a consistent increase in the likelihood of KRAS/
NRAS Q61H generation with the inclusion of SBS35 and SBS17b
(Extended Data Fig. 7d–f) and a dominant role of SBS17b as the
leading contributor of Q61H mutations.
We next investigated how mutational signatures influence EGFR
mutations (Fig. 3f). Similar to what we found for KRAS/NRAS
Q61H mutations, the EGFR S492R A>C mutation, which is common at acquired resistance25,30, was almost exclusively generated by
SBS17b. When the signature contributions at BL in tumours with
prolonged benefit were taken into account, SBS17b was the major
signature generating this mutation (Fig. 3g).
These results indicate that SBS17b and SBS35 activity are sufficient to explain the predominant evolution of KRAS/NRAS Q61H
and EGFR S492R mutations at acquired resistance in tumours where
these signatures are active.
SBS17b signature activity as a predictor of mutation evolution
and progression-free survival. To substantiate the relevance of
the SBS17b signature in patients, we investigated whether SBS17b
activity in BL samples can predict the evolution of specific drivers
at acquired resistance and of progression-free survival (PFS) in the
Prospect-C trial. SBS17b was detectable in five cases at BL, and a
bootstrap analysis confirmed the stability of the signature attribution (Fig. 4a). KRAS/NRAS Q61H T>G mutations evolved in four
of these cases and an EGFR S492R A>C mutation in one. No KRAS/
NRAS Q61H or EGFR S492R mutations were identified in tumours
without a detected SBS17b activity. This statistically significant
enrichment (P = 0.002, Fisher’s exact test) suggests that SBS17b
activity canalizes the evolution of these resistance driver mutations.
Furthermore, SBS17b predicted a significantly shorter PFS in the
prolonged-benefit group but not in primary progressors (P = 0.028,
log rank test, Fig. 4b).
We finally investigated the relationship of SBS17b with
KRAS/NRAS Q61H mutations in an independent cohort of 239
chemotherapy-treated CRC samples with KRAS/NRAS G12/G13 or
Q61H mutations20,31. Only eight tumours harboured Q61H mutations, and all had a detectable SBS17b activity compared with 79%
of tumours with KRAS/NRAS codon 12/13 mutations (Extended
Data Fig. 8a,b). Firm conclusions cannot be drawn because of the
small number of Q61H mutations, but the results do not contradict
the notion that Q61H mutations predominantly occur through signature SBS17b.
Discussion
We showed that KRAS/NRAS Q61H mutations are 11.8-fold to
21.1-fold more common at acquired resistance than in treatment-naive
KRAS/NRAS mutant CRCs. A pan-cancer analysis found a higher
selective advantage of codon 12/13 versus codon 61 mutations32,
questioning why a less beneficial mutation evolves with a strikingly
increased frequency after cetuximab treatment. It has been suggested
that Q61 mutations have higher oncogenic potential than codon
12/13 mutations when KRAS expression is low and that this explains
overrepresentation at acquired resistance33. Yet, there is little evidence
for lower KRAS/NRAS expression at acquired resistance. We have
now shown that Q61H is predominantly generated by SBS17b, which
is undetectable in most treatment-naive CRCs but present in 67%
of chemotherapy-treated CRCs3,5,26. The platinum signature SBS35
Nature Ecology & Evolution | www.nature.com/natecolevol
may further contribute. The preferential generation of Q61H mutations by these chemotherapy-induced signatures provides a compellingly simple explanation for the mutation bias between primary and
acquired resistance. SBS17b signature activity may also explain the
high prevalence of the S492R mutation among EGFR mutations25,34.
Prior analyses of large datasets with predominantly treatment-naive
tumours found no link between Signature 17 and KRAS/NRAS Q61
mutations35,36. This is a likely consequence of the low prevalence of
Q61 mutations in tumours that have not been treated with EGFR-AB
and of Signature 17 in the absence of 5-FU treatment.
Datasets for independent validation of these findings are not
available in the public domain, but our results are strengthened
by the use of data from a prospective trial (which limits selection
biases) and by four independent lines of evidence. First, we showed
that SBS17b disproportionally contributes to KRAS/NRAS Q61H
and EGFR S492R mutation generation. Second, the observed signature contribution in BL biopsies leads to an excess of KRAS/NRAS
Q61H mutations similar to that observed at acquired resistance.
Third, we showed that SBS17b at BL correlated with the evolution
of KRAS/NRAS Q61H and EGFR S492R mutations in individual
patients. Finally, PFS was shorter in patients where SBS17b was
detectable at BL, suggesting that this signature increases cancer
evolvability during cetuximab treatment. SBS17b activity may thus
be an evolutionary biomarker that predicts shorter PFS with cetuximab treatment. This hypothesis requires confirmation in future
clinical trials. By linking accelerated drug resistance evolution in
patients to chemotherapy-induced mutagenesis, our results further
highlight opportunities for the development of optimized treatment
sequences that restrain cancer evolution.
We found no increase in mutation loads at acquired resistance
and no evidence for cetuximab-mediated MMR deficiency. We
detected a 1% increase in SBS3 mutations in tumours with prolonged benefit. This may be the consequence of reduced HR fidelity
through cetuximab-induced mutagenesis; however, the change was
observed in only one patient. We also showed that SBS3 would contribute only minimally to KRAS/NRAS and EGFR mutations (Fig.
3d). Thus, despite the functional evidence for cetuximab-induced
mutagenesis in CRC cell lines12, our analysis in patients shows that
its contribution to cetuximab resistance evolution is probably small.
There are limitations of our analysis. Although it is the largest series
of paired biopsies from cetuximab-treated CRCs that has been interrogated by exome sequencing, the analysis of further cohorts (ideally by whole-genome sequencing) may strengthen the evidence for
drug-induced mutagenesis. Moreover, SBS3 is a ‘broad’ signature
with mutation motifs overlapping those of SBS5 and SBS40, which
may lead to signature bleeding. Using two independent signature
assignment algorithms, we demonstrated the largest discrepancy in
these broad signatures, which highlights the technical difficulties of
disentangling signatures.
Taken together, this exploratory analysis indicates that
chemotherapy-induced mutation signatures can influence and predict the evolution of cetuximab resistance in CRC patients. This
defines a strategy for the development of evolutionary biomarkers
in precision cancer medicine.
Methods
Trial design and samples. Prospect-C is a single-arm phase II trial that investigated
biomarkers of response or resistance to single-agent cetuximab in KRAS/NRAS
wild-type metastatic CRCs ( />The trial has previously been described in detail3. Patient characteristics are
described in Supplementary Table 1. The study was carried out in accordance with
the Declaration of Helsinki and approved by the national UK ethics committee
(approval number: 12/LO/0914). Written informed consent for trial participation
and the molecular analysis of tumour biopsies was obtained from all patients.
Patient selection. The 21 cases analysed in this study were selected only on the
basis of sufficient DNA availability from biopsies and the inferred cancer cell
contents. Cancer cell contents were estimated using the variant allele frequency of
Articles
the somatic mutations. Furthermore, we required an adequate cancer cell content
to construct the integer copy number profile for clonality assessment. Cancer cell
content and the integer copy number profiles have been presented previously3.
Somatic mutation and clonality assessment. Published mutation calls were
reanalysed3,26. A mutation call with variant allele frequency less than 5% was
considered absent in either paired biopsy. The clonality of somatic variants was
assessed as previously described3.
Mutational signature analysis. We identified a set of potentially active signatures
by comparing with the ColoRect-AdenoCa samples from the PCAWG7 TCGA
exome cohort (syn11801497.7). This was done by selecting signatures with any
non-zero mutation attribution to ensure that the widest set of relevant signatures
were included at the first stage. We added, if required, a further six signatures with
aetiology associated with HR deficiency (SBS3) and MMR deficiency (SBS6, SBS15,
SBS21, SBS26 and SBS44) to test the acquired resistance model hypothesis and a
further two signatures associated with platinum chemotherapy treatment (SBS31
and SBS35) that may be relevant to the samples analysed in our cohort. This
resulted in 21 signatures in total.
The SBS mutation profiles for each patient biopsy were fitted to the SigProfiler
exome SBS signatures (syn12026190) using whichSignatures in the deconstructSigs24
(v.1.8.0) R library. A second method of signature decomposition was applied using
the fit_to_signatures function in the MutationalPatterns23 R library (v.2.99.7) to
assess mutation assignment bias between two independent approaches.
The inclusion of too many signatures would increase the likelihood of
misassignment. We therefore looked to identify a set of signatures active in
the Prospect-C samples for subsequent analysis. We applied a generalized
cut-off to discard signatures with insufficient cohort-wide contribution. This
required the total assignment of mutations to contribute a minimum of 3% of
all single-nucleotide variants across the cohort to consider the signature active
(Extended Data Fig. 4a). This subset was further strengthened when looking just
at prolonged-benefit PD samples to ensure that potentially relevant signatures that
may be involved in resistance driver acquisition were being considered (Extended
Data Fig. 4b). Furthermore, despite not achieving the criteria, we included SBS17a
due to the inclusion of the ‘connected’ SBS17b signature37.
The observed and reconstructed mutation profiles show residual differences.
This error represents an unexplained portion of the mutation profile that is
not captured by the signature subset. We estimated the proportion of variance
explained by the signature set using a standard coefficient of determination (R2)
measure. This was calculated using the computeExplainedVariance function in the
decompTumor2Sig38 R library (v.2.6.0). The signature weights were subsequently
rescaled proportional to the explained variance (R2) of each sample. The remaining
variance (1 − R2) was considered unexplained.
Microsatellite tract length analysis. MSIsensor39 (v.0.6) scan was run on the
complete hg19 reference sequence to identify homopolymer and microsatellite
regions with a minimum of five consecutive repeats. This identified a total of
23,147,854 regions. The regions were filtered for those located on autosomal
chromosomes. MSIsensor msi was run on each BL and PD pair, ensuring that all
regions had a minimum of 20× coverage and were located within SureSelect v.5
target regions. All microsatellites that showed a significant difference in length
distribution were manually reviewed to identify those that showed an increase
in the PD sample. The ratio proportion of microsatellites with increased length
variability divided by the total number of assessed microsatellites defines the
MSI-score.
KRAS, NRAS and EGFR mutation codon biases. Somatic mutation calls from
TCGA were downloaded from the cBio web portal40,41 by selecting for ‘Colorectal
Adenocarcinoma’ in the PanCancer Atlas. Mutation calls from studies3,5,26 that
reported the specific base-change alterations in KRAS, NRAS and EGFR mutations
in ctDNA were pooled to generate a comparative distribution from CRCs with
acquired resistance to EGFR-AB. Only cases with KRAS/NRAS codon 12/13/61
mutations were included, and these mutations were assessed. Mutation calls in
KRAS were also identified from ctDNA in the CORRECT trial28. Similarly, only
KRAS codon 12/13/61 mutations were analysed. EGFR mutation calls in refs. 3,5
were used to assess mutation codon biases in EGFR at acquired resistance.
To assess the relevance of mutational signature activity to the generation of
KRAS, NRAS and EGFR hotspot mutations, we modelled a BL prolonged-benefit
profile using the deconstructSigs signature weights generated for the corresponding
12 tumours (Supplementary Table 2). The weights were rescaled to sum to the
explained variance of the sample (R2) and then multiplied by the corresponding
mutation load to generate mutation attributions corresponding to each signature
for each tumour. The mutation totals were then summed across the tumours and
converted to an overall proportional contribution of each signature.
The reference signature profile confers the likelihood of observing a mutation
corresponding to each of the 96 trinucleotide mutation motifs if the signature is
active. However, the trinucleotide frequencies across the exome are not evenly
distributed, and so this must be adjusted to assess the likelihood of a specific
mutation occurring. We used the function get_context_freq in the SigsPack42 R
NATuRE EColoGy & EvoluTIon
library to calculate the frequency of each trinucleotide context across the exonic
regions and normalized the reference signatures to reflect a profile with even
context frequency using the normalize function in SigsPack.
The normalized reference signatures were rescaled using the signature
proportions obtained from the BL prolonged-benefit tumours to generate a
mutation probability profile. The resulting matrix confers the contribution of each
individual signature to the overall probability of a mutation occurring at each of
the 96 trinucleotide motifs (Extended Data Fig. 7a). The mutation probabilities of
KRAS, NRAS and EGFR hotspot mutations observed at acquired resistance were
extracted and rescaled proportional to all contexts (Fig. 3d,g).
To assess the impact of the chemotherapy-induced signatures, SBS17b (5-FU)
and SBS35 (platinum), on the acquisition of KRAS/NRAS Q61H mutations, we
calculated the mutation probabilities of trinucleotide contexts corresponding to
observed codon 12/13/61 hotspot mutations. The observed mutation signature
attributions were adjusted to reflect the period in which they were likely to
be active. For instance, the clock-like signatures (SBS1, SBS5 and SBS40) have
accumulated mutations over the lifetime of the patient. In contrast, SBS17b and
SBS35 are assumed to be detectable only after chemotherapy treatment. As the
activity of SBS3, SBS6, SBS15 and SBS17a has not been reported to increase
following chemotherapy treatment, these signatures were initially modelled
as active throughout the patient life-course. We modelled a constant mutation
accumulation of these signatures from birth to diagnosis, followed by an
accelerated mutation accumulation ten times the rate29 during the tumour growth
period from diagnosis to BL biopsy. The attributions of these signatures during
the growth phase were combined with the chemotherapy signature attributions to
generate an adjusted weight matrix.
We applied the model with and without a zero constraint on the corresponding
signature weight. The probabilities calculated for each hotspot mutation context
were summed to demonstrate the resulting likelihood of each hotspot mutation.
Furthermore, we modelled a range of realistic parameters to reflect the uncertainty
of the time of tumour growth from malignant transformation (2.7–5.4 yr), the
acceleration of mutation rates during this period (×1, ×5 and ×10) and the time
point at which the HR, MMR and SBS17a signatures become active.
The stability of the SBS17b attributions was assessed by bootstrap analysis
using the function resample_mut_mat from the MutationalPatterns23 R library.
This involves resampling the mutation count matrix using the observed context
counts as probabilities. We specified 1,000 bootstrap replicates. The signature
decomposition was then calculated for each replicate, and percentile descriptives
were plotted.
Kaplan–Meier analysis. The survfit function in the Survival (v.2.44-1.1) R library
was used to run the Kaplan–Meier analysis. PFS was measured from the start of
treatment to the date of progression or death from any cause.
SBS17b signature activity in an independent CRC cohort. The mutation
calling from 536 whole-genome-sequenced colorectal metastatic samples
was obtained from Hartwig Medical Foundation31. A de novo non-negative
matrix-factorization-based mutational signature extraction was performed using
SigProfilerJulia20,43. Two signatures with high cosine similarity to the canonical
PCAWG SBS17b15 (related to 5-FU and the canonical signature) were selected.
Samples with exposure to any of these signatures were deemed as SBS17b active.
Quantification and statistical analysis. All analyses were performed in R
(v.3.5.0)44. All P values are two-sided, and P < 0.05 was considered significant. All
t-tests were unpaired unless otherwise stated.
Reporting Summary. Further information on research design is available in the
Nature Research Reporting Summary linked to this article.
Data availability
All analyses were performed on previously published datasets3,5,20,26–28. The datasets
can be accessed as described in the primary publications. The DNA sequencing
data from the Prospect-C trial are deposited in the European Genome-phenome
Archive with the accession code EGAS00001003367. As they include exome
sequencing data that could permit the re-identification of trial participants, a data
sharing agreement is required as stated in the primary publication3.
Code availability
The custom code to reproduce the mutational signature modelling
is freely available on Github ( />Evolution-of-anti-EGFR-antibody-resistance).
Received: 8 June 2020; Accepted: 20 April 2021;
Published: xx xx xxxx
References
1. Karapetis, C. S. et al. K-ras mutations and benefit from cetuximab in
advanced colorectal cancer. N. Engl. J. Med. 359, 1757–1765 (2008).
Nature Ecology & Evolution | www.nature.com/natecolevol
Articles
NATuRE EColoGy & EvoluTIon
2. Van Cutsem, E. et al. Fluorouracil, leucovorin, and irinotecan plus cetuximab
treatment and RAS mutations in colorectal cancer. J. Clin. Oncol. 33,
692–700 (2015).
3. Woolston, A. et al. Genomic and transcriptomic determinants of therapy
resistance and immune landscape evolution during anti-EGFR treatment in
colorectal cancer. Cancer Cell 36, 35–50.e9 (2019).
4. Misale, S. et al. Emergence of KRAS mutations and acquired resistance to
anti-EGFR therapy in colorectal cancer. Nature 486, 532–536 (2012).
5. Bettegowda, C. et al. Detection of circulating tumor DNA in early- and
late-stage human malignancies. Sci. Transl. Med. 6, 224ra24 (2014).
6. Montagut, C. et al. Identification of a mutation in the extracellular domain of
the Epidermal Growth Factor Receptor conferring cetuximab resistance in
colorectal cancer. Nat. Med. 18, 221–223 (2012).
7. Lipinski, K. A. et al. Cancer evolution and the limits of predictability in
precision cancer medicine. Trends Cancer 2, 49–63 (2016).
8. Maley, C. C. et al. Classifying the evolutionary and ecological features of
neoplasms. Nat. Rev. Cancer 17, 605–619 (2017).
9. Alexandrov, L. B. et al. Signatures of mutational processes in human cancer.
Nature 500, 415–421 (2013).
10.Gerlinger, M. & Swanton, C. How Darwinian models inform therapeutic
failure initiated by clonal heterogeneity in cancer medicine. Br. J. Cancer 103,
1139–1143 (2010).
11.Diaz, L. A. Jr. et al. The molecular evolution of acquired resistance to targeted
EGFR blockade in colorectal cancers. Nature 486, 537–540 (2012).
12.Russo, M. et al. Adaptive mutability of colorectal cancers in response to
targeted therapies. Science 366, 1473–1480 (2019).
13.Gerlinger, M. Targeted drugs ramp up cancer mutability. Science 366,
1452–1453 (2019).
14.Kim, T. M., Laird, P. W. & Park, P. J. The landscape of microsatellite instability
in colorectal and endometrial cancer genomes. Cell 155, 858–868 (2013).
15.Alexandrov, L. B. et al. The repertoire of mutational signatures in human
cancer. Nature 578, 94–101 (2020).
16.Maura, F. et al. A practical guide for mutational signature analysis in
hematological malignancies. Nat. Commun. 10, 2969 (2019).
17.Alexandrov, L. B. et al. Clock-like mutational processes in human somatic
cells. Nat. Genet. 47, 1402–1407 (2015).
18.Sveen, A. et al. Multilevel genomics of colorectal cancers with microsatellite
instability—clinical impact of JAK1 mutations and consensus molecular
subtype 1. Genome Med. 9, 46 (2017).
19.Christensen, S. et al. 5-fluorouracil treatment induces characteristic T>G
mutations in human cancer. Nat. Commun. 10, 4571 (2019).
20.Pich, O. et al. The mutational footprints of cancer therapies. Nat. Genet. 51,
1732–1740 (2019).
21.Tomkova, M., Tomek, J., Kriaucionis, S. & Schuster-Bockler, B. Mutational
signature distribution varies with DNA replication timing and strand
asymmetry. Genome Biol. 19, 129 (2018).
22.Meier, B. et al. Mutational signatures of DNA mismatch repair deficiency in
C. elegans and human cancers. Genome Res. 28, 666–675 (2018).
23.Blokzijl, F., Janssen, R., van Boxtel, R. & Cuppen, E. MutationalPatterns:
comprehensive genome-wide analysis of mutational processes. Genome Med.
10, 33 (2018).
24.Rosenthal, R., McGranahan, N., Herrero, J., Taylor, B. S. & Swanton, C.
DeconstructSigs: delineating mutational processes in single tumors
distinguishes DNA repair deficiencies and patterns of carcinoma evolution.
Genome Biol. 17, 31 (2016).
25.Arena, S. et al. Emergence of multiple EGFR extracellular mutations
during cetuximab treatment in colorectal cancer. Clin. Cancer Res. 21,
2157–2166 (2015).
26.Khan, K. H. et al. Longitudinal liquid biopsy and mathematical modeling of
clonal evolution forecast time to treatment failure in the PROSPECT-C phase
II colorectal cancer clinical trial. Cancer Discov. 8, 1270–1285 (2018).
27.The Cancer Genome Atlas Research Network et al. The Cancer Genome Atlas
Pan-Cancer analysis project. Nat. Genet. 45, 1113–1120 (2013).
28.Tabernero, J. et al. Analysis of circulating DNA and protein biomarkers to
predict the clinical activity of regorafenib and assess prognosis in patients
with metastatic colorectal cancer: a retrospective, exploratory analysis of the
CORRECT trial. Lancet Oncol. 16, 937–948 (2015).
29.Gerstung, M. et al. The evolutionary history of 2,658 cancers. Nature 578,
122–128 (2020).
30.Price, T. et al. Frequency of S492R mutations in the epidermal growth factor
receptor: analysis of plasma DNA from patients with metastatic colorectal
cancer treated with panitumumab or cetuximab monotherapy. Cancer Biol.
Ther. 21, 891–898 (2020).
31.Priestley, P. et al. Pan-cancer whole-genome analyses of metastatic solid
tumours. Nature 575, 210–216 (2019).
Nature Ecology & Evolution | www.nature.com/natecolevol
32.Cannataro, V. L., Gaffney, S. G. & Townsend, J. P. Effect sizes of somatic
mutations in cancer. J. Natl Cancer Inst. 110, 1171–1177 (2018).
33.Ali, M. et al. Codon bias imposes a targetable limitation on KRAS-driven
therapeutic resistance. Nat. Commun. 8, 15617 (2017).
34.Montagut, C. et al. Efficacy of Sym004 in patients with metastatic colorectal
cancer with acquired resistance to anti-EGFR therapy and molecularly
selected by circulating tumor DNA analyses: a phase 2 randomized clinical
trial. JAMA Oncol. 4, e175245 (2018).
35.Poulos, R. C., Wong, Y. T., Ryan, R., Pang, H. & Wong, J. W. H. Analysis of
7,815 cancer exomes reveals associations between mutational processes and
somatic driver mutations. PLoS Genet. 14, e1007779 (2018).
36.Temko, D., Tomlinson, I. P. M., Severini, S., Schuster-Bockler, B. & Graham,
T. A. The effects of mutational processes and selection on driver mutations
across cancer types. Nat. Commun. 9, 1857 (2018).
37.Poetsch, A. R. The genomics of oxidative DNA damage, repair, and resulting
mutagenesis. Comput. Struct. Biotechnol. J. 18, 207–219 (2020).
38.Kruger, S. & Piro, R. M. decompTumor2Sig: identification of mutational
signatures active in individual tumors. BMC Bioinform. 20, 152 (2019).
39.Niu, B. et al. MSIsensor: microsatellite instability detection using paired
tumor-normal sequence data. Bioinformatics 30, 1015–1016 (2014).
40.Cerami, E. et al. The cBio cancer genomics portal: an open platform for
exploring multidimensional cancer genomics data. Cancer Discov. 2,
401–404 (2012).
41.Gao, J. et al. Integrative analysis of complex cancer genomics and clinical
profiles using the cBioPortal. Sci. Signal 6, pl1 (2013).
42.Schumann, F. et al. SigsPack, a package for cancer mutational signatures.
BMC Bioinform. 20, 450 (2019).
43.Alexandrov, L. B., Nik-Zainal, S., Wedge, D. C., Campbell, P. J. & Stratton, M.
R. Deciphering signatures of mutational processes operative in human cancer.
Cell Rep. 3, 246–259 (2013).
44.R Core Team R: A Language and Environment for Statistical Computing v.3.5.0
(R Foundation for Statistical Computing, 2018).
Acknowledgements
D.C. received funding from the NIHR Biomedical Research Centre for Cancer at the
Institute of Cancer Research and the Royal Marsden Hospital. M.G., A.W. and L.J.B.
received funding from the European Research Council under the European Union’s
Horizon 2020 research and innovation programme (grant agreement no. 820137). The
paper is dedicated to the memory of Tim Morgan, who supported this work with a
generous donation.
Author contributions
M.G. conceived, funded and supervised the molecular analysis. D.C. is the chief
investigator of the Prospect-C trial and funded the trial. N.S., I.C., S.R. and D.W.
recruited the trial patients. B.G. prepared the trial samples, and N.M. supervised the
sequencing. L.J.B. performed the ctDNA sequencing and analysis. A.W. performed
the bioinformatics analysis. O.P. and N.L.-B. provided the analysis of metastatic CRC
samples from the Hartwig Medical Foundation. A.W. and M.G. performed the statistical
analysis. A.W. and M.G. wrote the manuscript. L.J.B., O.P. and N.L.-B. provided feedback.
All authors approved the final manuscript.
Competing interests
I.C. has consultant/advisory roles with Eli-Lilly, BMS, MSD, Merck KG, Roche, Bayer
and Five Prime Therapeutics. D.C. receives research funding from Amgen, Sanofi,
Merrimack, Astra Zeneca, Celegene, MedImmune, Bayer, 4SC, Clovis, Eli-Lilly, Janssen
and Merck KG. M.G. and N.S. receive research funding from Merck KG and BMS. The
other authors declare no competing interests.
Additional information
Extended data is available for this paper at />Supplementary information The online version contains supplementary material
available at />Correspondence and requests for materials should be addressed to M.G.
Peer review information Nature Ecology & Evolution thanks Christos Karapetis, Peter
Campbell and the other, anonymous, reviewer(s) for their contribution to the peer
review of this work.
Reprints and permissions information is available at www.nature.com/reprints.
Publisher’s note Springer Nature remains neutral with regard to jurisdictional claims in
published maps and institutional affiliations.
© The Author(s), under exclusive licence to Springer Nature Limited 2021
Articles
NATuRE EColoGy & EvoluTIon
Extended Data Fig. 1 | Plots of cancer cell content, sequencing depth and mutation load for the paired BL/PD biopsies from 21 patients in the
Prospect-C trial. a, Estimated cancer cell contents of paired BL and PD samples. A 1:1 ratio line has been added for reference. b, Mutation load vs. mean
sequencing depth for all BL and PD samples. p-value from Spearman’s test. A linear regression line has been added for reference. c, Mutation load vs.
cancer cell content for all BL and PD samples. p-value from Spearman’s test. A linear regression line has been added for reference.
Nature Ecology & Evolution | www.nature.com/natecolevol
NATuRE EColoGy & EvoluTIon
Articles
Extended Data Fig. 2 | Clonal mutation trees for 21 tumors from the Prospect-C trial. Grouped into cases with prolonged benefit and primary progression.
The numbers next to the trunk or the branches indicate clonal somatic mutations.
Nature Ecology & Evolution | www.nature.com/natecolevol
Articles
NATuRE EColoGy & EvoluTIon
Extended Data Fig. 3 | Number of unique mutations detected for each of 21 paired biopsies from the Prospect-C trial vs. time lapse between BL and PD
biopsies. p-value from Spearman’s test. A linear regression line has been added for reference.
Nature Ecology & Evolution | www.nature.com/natecolevol
NATuRE EColoGy & EvoluTIon
Articles
Extended Data Fig. 4 | Proportion of SBS mutations attributed to each mutational signature. Signatures were selected using the ‘ColoRect-AdenoCa’
samples from the SigProfiler TCGA whole exome cohort (n = 496) (syn11801497.7). All signatures in the cohort with a non-zero mutation attribution
were considered along with all MMR-deficiency signatures and platinum treatment signatures. Plots show the cohort wide signature attribution among
(a) all 21 Prospect-C samples and (b) only in the PD tumors of the 12 patients with prolonged benefit. The red horizontal dashed line illustrates the 3%
threshold used to define signatures as ‘active’ and the red box shows the signatures retained for subsequent analysis. SBS17a and SBS17b are described as
‘connected’ signatures15. SBS17a was retained due to the inclusion of SBS17b despite not reaching the threshold.
Nature Ecology & Evolution | www.nature.com/natecolevol
Articles
NATuRE EColoGy & EvoluTIon
Extended Data Fig. 5 | Signature attributions based on 21 paired BL/PD biopsies from the Prospect-C trial using MutationalPatterns and
deconstructSigs. a, Mutation signature attribution using independent decomposition methods (deconstructSigs and MutationalPatterns). b, Fig. 2
repeated with the ‘fit_to_sigs’ function in MutationalPatterns to assess the variability of estimates between methods.
Nature Ecology & Evolution | www.nature.com/natecolevol
NATuRE EColoGy & EvoluTIon
Articles
Extended Data Fig. 6 | Mutation frequency profiles of treatment naïve CRCs from the TCGA Pan-Cancer study vs. the KRAS hotspot mutations
identified in ref. 28. The TCGA profile has been adjusted to only consider KRAS mutations that were assessed in the CORRECT trial.
Nature Ecology & Evolution | www.nature.com/natecolevol
Articles
NATuRE EColoGy & EvoluTIon
Extended Data Fig. 7 | See next page for caption.
Nature Ecology & Evolution | www.nature.com/natecolevol
NATuRE EColoGy & EvoluTIon
Articles
Extended Data Fig. 7 | Modelling the impact of mutational signatures on the likelihood of acquired hotspot mutations. a, Modelled mutational profile of
a BL tumor with prolonged benefit. Exome normalised reference signatures have been scaled by the observed signature exposures of the 12 BL tumors with
prolonged benefit to represent a mutation probability at each trinucleotide mutation context. b, Observed mutation frequencies of KRAS/NRAS Q61H vs.
all other KRAS/NRAS hotspot mutations identified in CRCs with acquired EGFR-AB resistance3,5,26. c, Modelled mutation accumulation of the permanent
signatures. A varying acceleration parameter of x1, x5, x10 is applied to the tumor growth period. d, Impact of SBS17b and SBS35 on the likelihood of
generating KRAS/NRAS Q61H mutations vs. all other detected KRAS/NRAS hotspot mutations.
Nature Ecology & Evolution | www.nature.com/natecolevol
Articles
NATuRE EColoGy & EvoluTIon
Extended Data Fig. 8 | Analysis of an independent cohort of 239 patients with metastatic colorectal cancer and a KRAS/NRAS G12/G13 or Q61H
mutation. a, Total mutations attributed to SBS17b. Statistical significance was assessed with the Fisher’s exact test. b, Proportion of tumors with a
detectable SBS17b signature activity. Statistical significance was assessed with the Mann-Whitney U test.
Nature Ecology & Evolution | www.nature.com/natecolevol
Last updated by author(s): Apr 14, 2021
Reporting Summary
Nature Research wishes to improve the reproducibility of the work that we publish. This form provides structure for consistency and transparency
in reporting. For further information on Nature Research policies, see our Editorial Policies and the Editorial Policy Checklist.
nature research | reporting summary
Corresponding author(s): Dr Marco Gerlinger
Statistics
For all statistical analyses, confirm that the following items are present in the figure legend, table legend, main text, or Methods section.
n/a Confirmed
The exact sample size (n) for each experimental group/condition, given as a discrete number and unit of measurement
A statement on whether measurements were taken from distinct samples or whether the same sample was measured repeatedly
The statistical test(s) used AND whether they are one- or two-sided
Only common tests should be described solely by name; describe more complex techniques in the Methods section.
A description of all covariates tested
A description of any assumptions or corrections, such as tests of normality and adjustment for multiple comparisons
A full description of the statistical parameters including central tendency (e.g. means) or other basic estimates (e.g. regression coefficient)
AND variation (e.g. standard deviation) or associated estimates of uncertainty (e.g. confidence intervals)
For null hypothesis testing, the test statistic (e.g. F, t, r) with confidence intervals, effect sizes, degrees of freedom and P value noted
Give P values as exact values whenever suitable.
For Bayesian analysis, information on the choice of priors and Markov chain Monte Carlo settings
For hierarchical and complex designs, identification of the appropriate level for tests and full reporting of outcomes
Estimates of effect sizes (e.g. Cohen's d, Pearson's r), indicating how they were calculated
Our web collection on statistics for biologists contains articles on many of the points above.
Software and code
Policy information about availability of computer code
Data collection
No software was used. The study is a re-analysis of an already published data ( />
Data analysis
Custom code was used to model the contribution of mutational signatures to the probable generation of driver mutations. This has been
made freely available on github ( All other analysis uses published
algorithms/softwares and is cited in the text along with version information. The steps in which the methods have been used are fully
described in the Methods section and non-default run parameters are reported where necessary.
For manuscripts utilizing custom algorithms or software that are central to the research but not yet described in published literature, software must be made available to editors and
reviewers. We strongly encourage code deposition in a community repository (e.g. GitHub). See the Nature Research guidelines for submitting code & software for further information.
Data
- Accession codes, unique identifiers, or web links for publicly available datasets
- A list of figures that have associated raw data
- A description of any restrictions on data availability
April 2020
Policy information about availability of data
All manuscripts must include a data availability statement. This statement should provide the following information, where applicable:
All analyses were performed on previously published datasets2,3,5,20,26,27. The datasets can be accessed as described in the primary publications. DNA
sequencing data from the Prospect-C trial is deposited in The European Genome-phenome Archive with the accession code EGAS00001003367 (https://
www.ebi.ac.uk/ega/studies/EGAS00001003367). As they include exome sequencing data that could potentially permit the re-identification of trial participants, a
data sharing agreement is required as stated in the primary publication.
1
Please select the one below that is the best fit for your research. If you are not sure, read the appropriate sections before making your selection.
Life sciences
Behavioural & social sciences
Ecological, evolutionary & environmental sciences
For a reference copy of the document with all sections, see nature.com/documents/nr-reporting-summary-flat.pdf
Life sciences study design
All studies must disclose on these points even when the disclosure is negative.
Sample size
Paired BL/PD biopsies from 21 patients were successfully analyzed by exome sequencing and had sufficient cancer cell content for
bioinformatics analysis.
Data exclusions
No data matching the above inclusion criteria were excluded.
Replication
NA
Randomization
NA
Blinding
NA
nature research | reporting summary
Field-specific reporting
Reporting for specific materials, systems and methods
We require information from authors about some types of materials, experimental systems and methods used in many studies. Here, indicate whether each material,
system or method listed is relevant to your study. If you are not sure if a list item applies to your research, read the appropriate section before selecting a response.
Materials & experimental systems
Methods
n/a Involved in the study
n/a Involved in the study
Antibodies
ChIP-seq
Eukaryotic cell lines
Flow cytometry
Palaeontology and archaeology
MRI-based neuroimaging
Animals and other organisms
Human research participants
Clinical data
Dual use research of concern
Human research participants
Policy information about studies involving human research participants
Population characteristics
This study is a re-analysis of an already published dataset. Trial information, including details of recruitment and ethics, have
been described previously ( Patient characteristics were provided in
Supplementary Table S1 of the primary publication.
Information relating to the clinical trial and ethical approval are further reported in this study. We also include sex, number
and age descriptives of the participants in Supplementary Table 1.
The Prospect-C trial is a prospective translational study investigating biomarkers of response or resistance to anti-EGFR-Abtherapy in KRAS WT chemo-refractory metastatic CRC. No NRAS mutant cases were enrolled as the licensed cetuximab (CET)
indication changed to KRAS and NRAS WT CRC during the trial. Pts who were at least 18 years old and had a World Health
Organization performance status of 0-2, were eligible if: all conventional treatment options including fluorouracil, irinotecan,
oxaliplatin were exhausted or pts were intolerant/had contraindications for oxaliplatin/irinotecan-based chemotherapy; they
had metastatic cancer amenable to biopsy and repeat measurements with computed tomography (CT) scanning.
Ethics oversight
The study was carried out in accordance with the Declaration of Helsinki and approved by the national UK ethics committee
(approval number: 12/LO/0914). Written informed consent for trial participation and the molecular analysis of tumor
biopsies was obtained from all patients.
April 2020
Recruitment
Note that full information on the approval of the study protocol must also be provided in the manuscript.
2
Policy information about clinical studies
All manuscripts should comply with the ICMJE guidelines for publication of clinical research and a completed CONSORT checklist must be included with all submissions.
Clinical trial registration clinicaltrials.gov/ct2/show/NCT02994888
Study protocol
The trial protocol is available on request from the corresponding author.
Data collection
The study was carried out at the Royal Marsden hospital between November 2012 and December 2016.
Outcomes
The identification of biomarkers of primary and acquired resistance to CET therapy in DNA and RNA from CRC tumor biopsies was the
primary endpoint of the study. The study recruited to the recruitment target of 30 pts that had been treated and had BL and PD
samples available for genetic analyses. After removing cases with insufficient DNA yield or tumor content based on sequencing
results, data from 24 paired BL and PD samples was available for mutation and copy number analysis. 11 cases from which only a BL
biopsy was available were included in the analysis. Secondary endpoints included the identification and validation of biomarkers for
resistance and response to CET in RNA and ctDNA. The trial protocol also permitted further exploratory molecular analyses.
nature research | reporting summary
Clinical data
April 2020
3