Step by step trading alexander elder (2015)
Bạn đang xem bản rút gọn của tài liệu. Xem và tải ngay bản đầy đủ của tài liệu tại đây (4.7 MB, 76 trang )
Step by Step Trading
By Dr. Alexander Elder
Copyright 2015 by Dr. Alexander Elder
All charts by StockCharts.com – used with permission.
ISBN: 978-0-9744942-5-8
Published by elder.com
LEGAL: No part of this publication may be reproduced, stored in a retrieval system, or
transmitted in any form or by any means without the prior written permission of the copyright
owner.
DISCLAIMER OF WARRANTY: while the author has used his best efforts in preparing this
book, he makes no representations or warranties with respect to the accuracy or completeness of
the contents. The advice and strategies contained herein may not be appropriate for your
situation. You should consult with a professional where appropriate. The author shall not be
responsible for any loss.
Books by Dr. Alexander Elder
In chronological order:
Trading for a Living
Study Guide for Trading for a Living
Rubles to Dollars
Come into My Trading Room
Study Guide for Come into My Trading Room
Straying from the Flock: Travels in New Zealand
Entries & Exits: Visits to 16 Trading Rooms
Study Guide for Entries & Exits
The New Sell & Sell Short (with Study Guide)
To Trade or Not to Trade: A Beginner’s Guide (e-book)
Two Roads Diverged: Trading Divergences (e-book)
The New High – New Low Index (e-book), with Kerry Lovvorn
Additive Manufacturing (e-book)
The Trading Puzzle – Book One (e-book), with Kerry Lovvorn
The New Trading for a Living
Study Guide for The New Trading for a Living
Table of Contents
Free updates and the honor code
Starting Out on Your Journey
Markets are tough
Two steps that will put you ahead of the crowd
How to control risk
Good records make good traders
Technical Analysis
StockCharts Basics
Let’s create a chart (actually, two charts)
Dressing a naked chart: a pair of moving averages
Profits from manic-depression (using envelopes)
The power of bulls and bears (MACD indicator)
May the force be with you (Force index)
Less is more (other indicators)
Trading Systems
The trades to avoid (the Impulse system)
Every trade deserves a name (the system you trade)
Buying pullbacks in an uptrend
Catching reversals (false breakout with a divergence)
An end-of-day trend-following system (by Kerry Lovvorn)
Trading with fundamentals and technicals (by Philip Wu)
Trade Management
The sweet spot (what timeframe will you trade?)
Stops, targets, and risk control
Your visual diary
The road ahead
Sources
Acknowledgments
About the author
Free updates and the honor code
After we accumulate feedback for this e-book, we plan to issue an updated edition and send it at
no charge to all purchasers. If you bought this book from Elder.com, you’ll automatically
receive an update. If you bought it elsewhere, please let us know, and we’ll add your email to
our list for future updates. We have a strict privacy policy and will never release your
information to anyone.
Please do not forward this book to your friends (i.e. commit piracy). Instead, email your friends
this link to make sure they receive the latest update.
Please do not copy this book.
I put several hundred hours of work into writing. Please reciprocate my trust in you by sending
your friends the above link rather than pirating the book.
And now, let’s embark on our journey.
Dr. Alexander Elder
Vermont, March 2015
Return to the top
Starting Out on Your Journey
Congratulations on becoming a StockCharts.com member. You have taken an important step
towards becoming a successful trader. This book will guide you through the next several steps.
My goal in writing it was to help you avoid common pitfalls and master the key principles that
will serve you for the rest of your trading life.
Most beginners jump into trading unprepared. They remind me of new skiers who hop into a
gondola and ride to the top of a mountain without a clue how to ski down its slopes. This book
will teach you the essentials of modern computerized trading. Even if you already have some
experience, you’ll find much that is useful and perhaps even surprising in this book.
To help you focus on the process of becoming a successful stock trader, I’ve included the key
lessons from my years of experience. This book, Step by Step Trading, will walk you through
the essentials of this fantastically interesting but demanding craft and teach you its main do’s and
don’ts. I believe that “less is more” in trading. Most traders needlessly complicate their work
and hurt their results instead of improving them.
I suggest reading this brief book at least twice. Begin by loading it onto your favorite tablet or
printing it out and read it once the old-fashioned way, relaxing in your favorite chair. Then go
back and re-read it while sitting in front of your StockCharts screen, and implement its lessons.
This will ensure that you absorb all of the essential information in this book.
We’ll begin by looking at the risks of trading and then set the essential money management
rules. We’ll continue our journey of discovery by going step-by-step through the exact chart
settings that I use – and of course explain how and why I use them. There is no need to waste
time re-inventing the wheel if you can benefit directly from my years of experience.
After that, I’ll show you several examples of trading systems and trade management techniques.
I’ll even give you a copy of the spreadsheet that I use to track my own trades. Take your time
working with this book to become a more knowledgeable and more disciplined trader.
Throughout this book you’ll find boxes like this one - they contain precise instructions on how to
duplicate my settings on your computer. If you are on the first reading of this book, you can skip
these and focus on the actual text. Later, when you are in front of your computer, follow these
instructions – step-by-step – to get your StockCharts account configured just like mine.
Return to the top
Markets are tough
Trading attracts us with its promise of money and freedom, challenge and excitement. Beginners
quickly discover how hard it is to take profits out of the market. Remember, the only easy thing
about trading is losing money!
The rewards of trading as well as its dangers are both are very real and you need to weigh them
before you jump in with both feet. If you decide to trade, you have a fascinating road ahead of
you. If you decide that trading is not for you, there is no shame in “Let me stand aside from the
markets for now.”
Before we analyze charts and look for stocks to buy or sell, let’s explore several basic questions:
what markets to trade, how to manage risk and why keep a trading journal.
Where will your trading profits come from? The money you hope to take out of the markets
currently resides in other people’s accounts. And all those men, women and corporations have
absolutely no desire to give money to you. As a matter of fact, right now, while you’re reading
this book, they’re crafting their trading plans, designed to take your money.
While you’re planning to pick their pockets, they’re working hard on trying to pick yours.
They’re probably more experienced in this game than a beginning trader. But your forthcoming
battle with them isn’t even your biggest problem.
Your greatest enemy – a bigger obstacle than any competitor, a grasping broker, or unstable
internet – is the person you see every morning in the mirror.
All beginners – and quite a few experienced traders who should know better – sabotage
themselves in ways that are sometimes sad, at other times hilarious, but almost always avoidable.
And they do it not once or twice, but over and over again, until their account is depleted or they
lose confidence and slink away from the markets.
The lack of knowledge, or to put it bluntly, ignorance, isn’t the biggest cause of trader mortality.
The two major causes of losing are the inability to control risk and to manage yourself. If you
learn to manage yourself in the markets and to control risks, you’ll ensure that you have enough
time to survive, clear up any lack of knowledge, and start taking profits from the markets.
Most people hate to face their own role in losing. This is why, if you want to become a
successful trader, you need to learn to manage yourself: write trading plans, calculate risks vs.
rewards, and complete your trading journal after each trade. Then you’ll rise above the masses
and start taking money from the markets.
The rules for managing risk that I’ll show you may feel annoying for beginners with tiny
accounts, because proper risk control limits trade size. Our greed pushes against risk
management. All traders have this powerful emotion – some of us have a lot and others an even
bigger lot.
Another hugely powerful emotion is fear, and it follows on the heels of greed. You get greedy,
put on an oversize trade, the market slaps you – and now fear kicks in. You become afraid to put
on a perfectly reasonable trade – and afterwards kick yourself for having missed an opportunity.
Poor risk management makes people lose courage as well as money.
This is why I want to begin this book on trading tools and systems with brief chapters on risk
control and self-management.
Return to the top
Two steps that will put you ahead of the crowd
The two key skills that separate winners from losers are risk control and self-control.
Managing risk in your account is pretty straightforward once you know the formulae, which
you’re about to see. A professional trader may allocate up to a third of his research time to
calculating money management angles, as he compares risks and rewards for different stocks.
He discards many stocks that look attractive but whose risk parameters don’t suit him.
How much time does an average beginner spend calculating and managing risk? Most likely
zero, zip, nada. Right before placing a trade he may briefly scratch his head or some other part
of his anatomy and decide to double his usual size because he made money in the previous trade
or skip this trade because he lost money in his previous trade. Both choices are equally wrong.
If you let your latest trade determine what size to trade next time, it means giving up control of
trade management. If you follow the formulae in this book for controlling risks, you’ll
accomplish a goal in which most beginners fail.
The second essential skill – self-control – is harder to quantify. Fortunately there is a clear and
concrete tool for implementing and measuring self-control: keeping good quality trading records.
After Entries & Exits, my book of interviews with traders, was published, people kept asking
what those traders had in common. The 16 traders in the book – men and women, long-term and
short-term traders, stocks, futures and options traders, American and foreign traders – what did
they have in common?
They all kept excellent records.
I say to my students: “Show me a trader with good records, and I’ll show you a good trader.
Show me a trader with poor or nonexistent records, and I’ll show you an average trader. And
that’s a very poor sight because an average trader loses money. The majority must lose in order
for a small, informed, and disciplined minority to make profits. We’ll pay attention to recordkeeping as well as risk management in this book.
Return to the top
How to control risk
An intelligent scuba diver always keeps an eye on his air tank’s pressure gauge to make sure he
has enough to return to the surface, with a safety margin. The money in your trading account is
your air supply. Watch it, be economical in its use, and have a reserve.
All beginners, no matter how bright, make mistakes and take losses. Be sure to keep your losses
small, don’t let them threaten your survival.
The most important rule of risk control is THE TWO PERCENT RULE: never risk more than
2% of your account equity on any given trade.
Begin by writing down three numbers for every trade: your entry, target and stop. Without them
a trade turns into a gamble – and you’re not here to gamble, are you?
Later, in the chapters on technical analysis, we’ll discuss how to set these three numbers. At this
point, simply recognize that every trade requires a stop and that the distance from your entry to
that stop determines how many dollars you’ll risk per share.
Let’s say you plan to buy a stock at $30 and expect it to rally to $35 – that is your target. As a
cautious person and not a gambler, you decide to place a protective stop at $28 – the level you
set through technical analysis, to be discussed later. Buying at $30 and protecting at $28 means
you’ll be risking $2 per share in this trade.
Next question: how much money do you have in your trading account? Let’s say you have
$20,000. What is 2% of $20,000? It is $400 – and that’s the maximum amount you’re allowed
risk on any trade.
Next question: how many shares of that stock may you buy? Well, if your maximum permitted
risk is $400 and your risk per share is $2, you may buy up to 200 shares. You may buy fewer
shares but you may not go above the number given to you by the 2% Rule.
The maximum number of shares you may buy is determined by your risk per share and your total
permitted risk.
Figure 01. The Iron Triangle of Risk Control
The Iron Triangle of Risk Control: “A” is the maximum risk for your account (2% of its current
value); “B” is your risk per share (the distance from your entry to your stop); “C” = A divided by
B.
You don’t have to risk 2% of your account on every trade – you’re perfectly welcome to risk
less, but you may never risk more. The bigger your account, the lower percentage you want to
risk.
THE SIX PERCENT RULE states that you must stop trading for the rest of the month
whenever your losses reach 6% of your account equity at the beginning of that month.
If and when losses start piling up, take that as a sign that your method isn’t working in the
current market environment. It’s time to pause and step aside for a while. Once your drawdown
hits 6%, that’s the end of trading for the current month – no new trades.
This is similar to placing a stop on a trade – the 6% Rule places a stop on your account, limiting
the maximum damage that can be caused by a series of losing trades. The 6% Rule breaks losing
streaks, giving you time to think and regroup.
Most traders get killed by fish – either a shark bite (a single disastrous loss) or piranha bites (a
series of losses, none of them lethal, but together they shred an account to the bone). The 2%
Rule will protect you from the sharks. The 6% Rule will save you from the piranhas.
You may never increase those limits, but feel free to lower them, especially the 2% maximum
loss per trade.
If you use the 2% and 6% rules, a series of only three losing trades can knock you out of the
game early in the month. If you reduce your maximum risk per trade to 1%, you’ll double the
number of trades you may take before being forced to step aside. Lowering your risk per trade to
1% or less will give you more latitude to practice your tactics.
Before we close this chapter, a quick comment on account size. A tiny account makes it very
hard to diversify, while large accounts tend to lull beginners into a false sense of security. At the
time of this writing, I’d say that the sweet spot for beginners is somewhere in the $20,000 to
$50,000 range. It is big enough to diversify but small enough not to get carried away.
Remember that an intelligent beginner trades to learn. Imagine going to a dental or an
engineering school: you wouldn’t expect to make a living out of it in your first year of schooling.
Focus on learning and acquiring skills, become a survival expert. Trade small and keep good
records. If you do it right from the start, you’ll be making good money later – instead of
overtrading, getting hurt near the starting line, and becoming demoralized.
Risk management will make you a safer trader. In the next chapter we’ll discuss good recordkeeping, a key tool for your growth as a trader.
Return to the top
Good records make good traders
Remember this rule: “it is OK to make mistakes, but not OK to repeat them.” It reminds me of a
Russian saying: “Don’t step on the same rake twice.” Many traders keep losing money,
repeating the same mistakes.
A habitual loser doesn’t remember what he did right and made money or what he did wrong and
lost. Had he remembered, he would have done more of the right stuff and stopped repeating the
wrong moves.
Let’s be realistic: it’s beyond human capacity to remember all the nitty-gritty details of trading
tools, systems, entries, exits, news reports, and a myriad of other details. That’s why we need to
write those things down. Successful traders keep good records, review them, and learn from
them.
You need to keep both numerical and visual records: a spreadsheet and marked-up charts of your
trades. StockCharts gives you a great way to mark up your charts and I’m going to give you a
spreadsheet you can use for numerical records. Let’s review the spreadsheet first.
You can download the spreadsheet in Excel format by clicking this link:
/>If you don’t have MS Excel, you can download this simplified version:
/>
Shown below are two lines from my spreadsheet, reflecting a trade I made while working on this
book. Notice that in addition to the usual numbers, such as entry and exit dates and prices, gross
and net profit or loss, this spreadsheet includes columns for rating the quality of each trade as
well as of every entry and exit. I call them buy, sell and trade grades. You have to grade your
performance in order to improve it.
Figure 02. Trader’s Spreadsheet
1: Source – where I got the idea for this trade. It could be myself, an article or a friend’s tip
2:Method – If Source is ‘self,’ then this is the method I used to find this trade.
3:Symbol – Symbol or ticker
4:Quant – How many shares
5:l/s – Long or short
6:Bought – Purchase price
7:Date – Date bought
8:Comm – Commission (since I first sold one half and then the other, I split this line in two).
9:Sold – Sell price
10:Date – Sold date
11:Comm – Sales commission
12:Fee – Exchange fees
13:P/L – Gross profit or loss
14:Net – Net profit or loss
15:Buy gr – Buy Grade (How far from the day’s high did I buy? See below for more)
16:Sell gr – Sell Grade (How far from the day’s low did I sell? See below for more)
17:Trade gr – Trade Grade (What percentage of the channel did I capture? See below for more)
18&19:Upchan & Downch – Upper and lower daily channel lines on the day I bought
20,21&22: High, low and close on the day I bought
23,24&25: High, low and close on the day I sold
The all-important Trade Grade reflects the percentage of the price channel that the trade earned
or lost. Prices flow in channels like rivers in their valleys. Your trade grade is the percentage of
the width of the valley that you captured in your trade. You will see how to construct channels
in one of the following chapters.
The TRADE GRADE: (Sell – Buy) / (Upper channel line – Lower channel line).
This formula compares your profit (or loss) in a trade to the spread between channel lines on the
day you entered that trade. Since the distance from the top to the bottom of a channel reflects a
realistic maximum available for a swing trade, the Trade Grade reflects the percentage of the
maximum you were able to catch. A grade above 30% makes an A-quality trade. Don’t swing
for the fences, set reasonable goals; anything above 30% is excellent.
Buy and Sell grades reflect the quality of every purchase or sale. Each of these grades is based
on a single bar, measuring how your entry or exit relates to the high and the low points of the
day.
The BUY GRADE: (High – Buy) / (High – Low)
You want to buy as far away from the high and as near the low of the daily bar as possible. If
you buy in the lower half of the daily bar, your rating for that buy is over 50%, which is
excellent.
The SELL GRADE: (Sell – Low) / (High – Low)
You want to sell as far away from the low and as near the high of the daily bar as possible. If
you sell in the upper half of the daily bar, your rating for that sell is over 50%, which is
excellent.
Your Buy and Sell Grades show where you stand in the never-ending battle against the pros who
make a living buying near the lows and selling near the highs. If you buy in the upper half of the
bar and sell in the lower half, you’re feeding the wolves. Of course no one can definitely tell
what will be the high and the low of the day, but getting consistently low ratings is a sign that
you’re chasing runaway prices and need to tighten your discipline.
The spreadsheet above shows two lines documenting one trade because I purchased that stock in
a single trade but sold it in two installments. This is marked by the entry commissions on both
lines being boxed together. My Buy Grade was 74%, meaning I bought near the bottom quarter
of that day. Notice also that the closing price for that day (Col. 2) is colored green because my
purchase price of $92.85 was below the closing price of $93.17. This meant that the trade was
profitable at closing time – another measure of its quality.
I exited the first half of the trade because I thought the market was becoming toppy and wanted
to take partial profits. My Sell Grade was 76%, based on the high and low of the sale day, but I
sold too early in the day. The stock closed for the day above my sale price, which is why I
colored the closing box in Col. 25 in red.
The next day the stock reversed and headed lower. I cut and ran, getting a poor sale grade of
only 21%, meaning I sold in the bottom quarter of the day – chasing the trend. Still, the stock
continued to decline after I sold and closed below my selling price, earning me a green box in
Column 25.
Both Trade Grades were good – 41% of the daily channel for the first sale and 40% for the
second. Both were above the 30% level that marks A-quality trades.
I hope you appreciate how much useful information about the quality of trades you can get from
analyzing a single line in a spreadsheet. Imagine how much more you can learn from analyzing
dozens of such lines.
In addition to numerical records and ratings of all your trades, it’s very educational to keep a
visual diary of your trades. Save a picture of your stock and its indicators on the day you buy it
and another picture on the day you sell. By reviewing them at a later date you’ll be able to see
what works well and what doesn’t work in your approach to trading. Those snapshots will turn
you into your own teacher.
StockCharts makes it easy to maintain a visual diary, combining price charts, indicators and
comments. Near the end of this book, after we’ve reviewed the analytic and decision-making
process, I will share with you my visual diary of this AMT trade and show you how to maintain
it in StockCharts.
Keeping a visual diary of your trades along with numerical records will set you apart from the
pack of competitors. You’ll rise above them by having what they don’t have: risk management
and record-keeping. These tasks aren’t nearly as exciting as looking for trades and entering them
– but they make all the difference between long-term winning and losing.
Note: For more thoughts on record-keeping, please see my book The New Trading for a Living.
Return to the top
Technical Analysis
StockCharts Basics
Experienced members may well skip this chapter, but please read it carefully if you are a new
member of StockCharts. It’ll help you to get more out of this book and apply its lessons to your
work.
Clicking on any chart in this book will take you to the same chart at www.StockCharts.com
(obviously, you need to be online to use this function). There you’ll be able to see that chart in a
larger format and explore all of its settings.
Figure 03. Your options in StockCharts.
A trader can use StockCharts without paying a dime (A). He or she can even access the site’s
remarkable ChartSchool (B). Still, membership (C) has its privileges, and the most important of
them is that the program can memorize any selections or changes a member makes on his charts.
If you add an indicator or change its parameters, the program will remember it, and you won’t
have to retype everything the next time you log in. You also get more indicators and tools.
To learn to use StockCharts, click on to view a gallery of sharp
and practical lessons. They are divided into the following chapters:
The Basics
Using SharpCharts
Additional Analysis Tools
Using ChartLists
Using ChartNotes
Scanning and Alerts
Those videos will help you understand your choices for plotting charts, changing their styles, and
creating lists. Be absolutely sure to watch the very first video in “The Basics” chapter – Getting
Started with StockCharts.com Watching that 17-minute video will save you multiple hours
down the road.
Let me briefly point out just three of the basic features of StockCharts: Overlays, Indicators, and
ChartStyles.
Figure 04. Overlays.
Overlays are studies that are superimposed on price plots, such as moving averages and
envelopes (more on those below). StockCharts allows you to have a huge number of overlays,
but we’ll stick to the essentials and not clutter our charts.
Figure 05. Indicators.
Indicators help us find when bulls or bears dominate a stock. You will see what indicators I use
to discover the shifts of power in the endless battles between those two groups. I like plotting
my indicators below prices, but that is simply a personal preference. Same as overlays, let’s not
clutter our charts but select a small number of clear and well understood indicators.
Figure 06. Advanced Options.
Notice that some of the overlays and indicators allow us to use advanced options. Those are
marked by green triangles, as shown above. You will see my selections in this book – but feel
free to change them, make them your own, with your own unique settings.
Figure 07. ChartStyles.
Arrow A in Figure 07 points to one of the most useful features of StockCharts – a menu of
ChartStyles. It gives you the ability to set up a chart exactly how you like and save that format
as a ChartStyle, so that in the future you can apply this template to any ticker with just a single
click.
The program also gives you some predefined ChartStyles, including my favorite “Elder’s
Weekly Stocks.” Arrow B points to where you can change the ticker and/or timeframe of a chart
with a single click.
Return to the top
Let’s create a chart (actually, two charts)
Every bar or candle you see on your chart represents market action during the period of time
covered by that bar or candle. A bar on a daily chart represents the range of prices during one
day. Its vertical line connects the high and the low points of that day, while the tick on the left
shows the opening price and the tick on the right the closing price. On a candlestick chart the
area between the opening and closing prices is thick. Candles are hollow if prices close above
the opening price or filled if they close below the opening price.
I use bar charts because that’s how I learned to trade, before candlesticks appeared in the US.
Keeping an eye on the opening and closing ticks gives me the same information as candles, and I
can fit more bars than candles on a computer screen. Even though this book uses bar charts, all
of its techniques can be used with candles.
To create a daily bar chart using StockCharts.com, follow these steps:
1.) Log into your account.
2.) Type a ticker symbol into the “Create a Chart” box at the top of the page. We’re going to use
AMZN for this example. Press the “Go” button when you are done.
3.) You should now be looking at a chart of AMZN with your “Default” chart settings. To see a
plain bar chart, click on the “ChartStyles” dropdown located below the chart and select “Plain
OHLC Bars” from the choices
A bar on a weekly chart reflects price action for one week, on a monthly chart for one month, on
an hourly chart for one hour, and so on. Markets move at the same time in different timeframes,
but sometimes they trend in opposite directions. For example, the trend may be rising on the
weekly chart but falling on the daily, challenging us to decide which one to follow. We’ll deal
with that in a moment, but please keep in mind that for a truly stereo vision of any stock you
must monitor it in more than one timeframe. Those who track a single timeframe miss important
information.
To change your chart to a different bar period, click on the “Period” dropdown, located above the
left corner of the chart, then select the new period that you want to see (e.g., weekly, 1 hour, 5 min,
etc.). Then click the “Update” button.
The key principle of using multiple timeframes is to make your strategic decision – to be a bull
or a bear – on a longer-term chart, then switch to a shorter-term chart for making tactical
decisions where to buy and sell. If the longer-term chart isn’t clear, don’t even bother going to
the shorter-term chart but move on to the next stock. We should look for trades only when the
strategic direction is clear.
Select two timeframes that relate to one another by approximately a factor of five. A weekly and
a daily chart make a good pair. Other good pairs are monthly and weekly for very long-term
trading or daily and hourly for shorter-term trading. The same approximate ratio applies to
intraday charts, such as 30- and 5-minute. Watching at least two timeframes is like looking at
the road ahead with both eyes. You wouldn’t want to drive with one eye closed. Let your
competitors do that, using only one timeframe.
Having selected a weekly and a daily pair, we’ll make our strategic decisions to buy, sell short,
or stand aside on the weekly chart. We’ll fine-tune and implement those decisions on the daily
chart.
What trading vehicles shall we chart? Let’s begin with the key indexes – the Dow, the Nasdaq,
and the S&P. If you live and trade outside the US, track the key stock index or indexes for your
country – for example the Toronto Stock Exchange index in Canada or All-Ordinaries in
Australia. Select a handful of popular, high-volume stocks to which you can give your
undivided attention. It’s better to update and review five charts every day than 20 charts once in
a while. Be extremely cautious using ETFs, most of which poorly track their underlying
vehicles. Avoid leveraged ETFs and volatility ETFs, which a respected colleague called “as
great a wealth-destroying machine as I've ever seen.” There is an in-depth review of six groups
of trading vehicles, including stocks and ETFs in The New Trading for a Living.
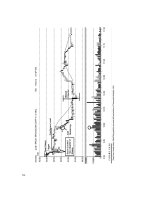
Figure 08. AMZN weekly
Clicking on any chart in this book will take you to the same chart at www.StockCharts.com (you
need to be online to use this function). You’ll be able to see that chart in a larger format, as well
as view and modify its settings.
Let’s take a look at two charts of Amazon.com – a weekly chart (above) and a daily chart
(below). Both are naked, without any technical indicators. Plain charting, the original approach
to technical analysis, has several pluses but even more minuses. On the one hand, charts reflect
everybody’s actions in any given market. On the other hand, trying to analyze a naked chart
tends to be very subjective.
Old market books are filled with descriptions of heads-and-shoulders, rectangles, triangles, etc.
The longer you squint at a chart, the more of them will seem to appear. If you feel bullish, you’ll
keep ‘finding’ patterns that point up, and if you’re bearish, you’ll be ‘seeing’ the ones pointing
down.