New frontiers in technical analysis (2011)
Bạn đang xem bản rút gọn của tài liệu. Xem và tải ngay bản đầy đủ của tài liệu tại đây (6.74 MB, 345 trang )
NEW FRONTIERS
IN TECHNICAL
ANALYSIS
Since 1996, Bloomberg Press has published books for financial professionals
on investing, economics, and policy affecting investors. Titles are written by
leading practitioners and authorities, and have been translated into more than
20 languages.
The Bloomberg Financial Series provides both core reference knowledge
and actionable information for financial professionals. The books are written by experts familiar with the work flows, challenges, and demands of
investment professionals who trade the markets, manage money, and analyze
investments in their capacity of growing and protecting wealth, hedging risk,
and generating revenue.
For a list of available titles, please visit our Web site at www.wiley.com/go/
bloombergpress.
NEW FRONTIERS
IN TECHNICAL
ANALYSIS
Effective Tools and Strategies for Trading
and Investing
Paul Ciana, CMT
Copyright © 2011 by Paul Ciana. All rights reserved.
Published by John Wiley & Sons, Inc., Hoboken, New Jersey.
Published simultaneously in Canada.
No part of this publication may be reproduced, stored in a retrieval system, or transmitted in any form or
by any means, electronic, mechanical, photocopying, recording, scanning, or otherwise, except as
permitted under Section 107 or 108 of the 1976 United States Copyright Act, without either the prior
written permission of the Publisher, or authorization through payment of the appropriate per-copy fee to
the Copyright Clearance Center, Inc., 222 Rosewood Drive, Danvers, MA 01923, (978) 750–8400, fax
(978) 646–8600, or on the Web at www.copyright.com. Requests to the Publisher for permission should
be addressed to the Permissions Department, John Wiley & Sons, Inc., 111 River Street, Hoboken, NJ
07030, (201) 748–6011, fax (201) 748–6008, or online at www.wiley.com/go/permissions.
Limit of Liability/Disclaimer of Warranty: While the publisher and author have used their best efforts in
preparing this book, they make no representations or warranties with respect to the accuracy or
completeness of the contents of this book and specifically disclaim any implied warranties of
merchantability or fitness for a particular purpose. No warranty may be created or extended by sales
representatives or written sales materials. The advice and strategies contained herein may not be suitable
for your situation. You should consult with a professional where appropriate. Neither the publisher nor
author shall be liable for any loss of profit or any other commercial damages, including but not limited to
special, incidental, consequential, or other damages.
DeMark Indicators R
Kase StatWareTM is a registered trademark of Kase and Company, Inc.
Know What’s NextTM
Market Profile R is a registered trademark of the CBOT.
TAS PRO Approach to Trading and Market Analysis
TAS PRO Dynamic VAP
TAS PRO Indicator Suite
TAS PRO Navigator
TAS PRO VAP Map
For general information on our other products and services or for technical support, please contact our
Customer Care Department within the United States at (800) 762-2974, outside the United States at
(317) 572-3993 or fax (317) 572-4002.
Wiley also publishes its books in a variety of electronic formats. Some content that appears in print may
not be available in electronic books. For more information about Wiley products, visit our web site at
www.wiley.com.
Library of Congress Cataloging-in-Publication Data:
Ciana, Paul, 1983–
New frontiers in technical analysis : effective tools and strategies for trading and investing / Paul Ciana.
p. cm. – (Bloomberg financial series)
Includes index.
ISBN 978-1-57660-376-5 (hardback); ISBN 978-1-118-155-608 (ebk); ISBN 978-0-470-879-085
(ebk); ISBN 978-1-118-155592 (ebk)
1. Investment analysis. 2. Investments. I. Title.
HG4529.C53 2011
332.63'2042–dc22
2011015868
Printed in the United States of America
10
9
8
7
6
5
4
3
2
1
This book is dedicated to my family,
in particular,
to the memory of my Grandmother, Charlotte Cianciulli,
and her 92 years of inspiring life, laughter, and love.
Contents
Preface
xi
Acknowledgments
xv
CHAPTER 1
Evidence of the Most Popular Technical Indicators
Paul Ciana, CMT
Defining Technical Analysis
Defining Chart Types
Evidence of Chart Type Popularity
Evidence of Technical Indicator Popularity
Applying the Most Popular Technical Indicators
Conclusion
CHAPTER 2
Everything Is Relative Strength Is Everything
Julius de Kempenaer
“This Time It’s Different”
What Is Comparative Relative Strength?
The JdK RS-Ratio and JdK RS-Momentum
Relative Rotation Graphs
Conclusion
CHAPTER 3
Applying Seasonality and Erlanger Studies
Philip B. Erlanger, CMT
Testing for a Valid Seasonal Cycle
Applying Cycles as a Strategy
1
2
5
10
14
18
45
49
50
51
65
75
83
85
86
94
vii
viii
Monitoring Seasonal Data
Erlanger Studies: The Art of the Squeeze Play
CHAPTER 4
Kase StatWareTM and Studies: Adding Precision to
Trading and Investing
Cynthia A. Kase, CMT, MFTA
Introduction to KaseSwing
Kase DevStops
Kase Momentum Divergence Algorithm
Kase PeakOscillator and KaseCD
Why Use KasePO and KaseCD?
Kase Permission Stochastic and Screen
Entering Trades and the Kase Easy Entry System
About the Kase Easy Entry System
Trading with Kase StatWare
Kase Bar Chart (Equal TrueRange Bar Chart)
Summary
CHAPTER 5
Rules-Based Trading and Market Analysis Using
Simplified Market Profile
Andrew Kezeli
Technical Analysis Is Simple in Theory—Difficult in Practice
Rules-Based Trading: Automated Strategy Trading versus
Discretionary Trading
Balance versus Imbalance: Distinguishing the Two Phases of
Market Activity
There Are Only Three Market Segments: Nontrending,
Uptrending, and Downtrending
Four Market Participants—and Then a Fifth . . .
Market Profile
Market Movement: The Four Steps of Market Activity
Market Structure
The Relative Speed of the Market’s Building-Block Components
Vertical Nondevelopment (“Minus Development”)
Simplifying Market Profile
TAS PRO VAP Map
Rules-Based Trading and Analysis with TAS PRO Navigator
Contents
101
108
155
157
169
177
188
189
199
201
206
209
211
215
217
218
221
222
224
228
231
234
236
239
240
245
247
255
Contents
TAS PRO Indicator Application Examples
Conclusion
CHAPTER 6
Advanced Trading Methods
Rick Knox
From the CBOT to the Charts
Trading by Gut Feeling
Understanding the Background of an Opportunity
They Say Entry Is Easy, but Not in My Book
Trade When the Odds Are in Your Favor
Don’t Fight the Trend
Trade Location Is Key to Long-term Success
Adjusting to Volatility
Anticipating What Needs to Happen
Using Time as Part of Your Risk Management
Learning to Control Your Emotions
The Hardest Part of Any Strategy Is the Exit
Putting It All Together: Two Examples
Picking Up the Right Tools
ix
257
280
283
283
287
288
295
299
300
301
302
303
304
306
306
307
310
Recommended Reading
313
About the Authors
315
Index
319
Preface
In the struggle for survival, the fittest win out at the expense of their rivals
because they succeed in adapting themselves best to their environment.
—Charles Darwin
This book has been assembled in response to the growing demand to
diversify an investment strategy through the numerous styles of contemporary
market analysis and the ongoing search for increasing alpha. Although the
most frequently used style of analysis is fundamental, the adoption of technical
analysis as an adjunct or preferred style of analysis is becoming increasingly
sought after and accepted.
This evolution has become visible in many ways. One observation discussed in Chapter 1 is the tracking and measurement of the use and growth of
charts and technical indicators in different regions of the world. Another observation is the growth rate of the number of market participants specializing
in technical analysis. In 2010, the Market Technician’s Association announced
there were more than 1,000 active Chartered Market Technicians (CMTs) residing in 76 countries, representing a 100 percent increase in only four years.
Yet another measure is the growing interest in and reliance on the development and implementation of innovative technical tools and strategies that
capitalize on existing methods, such as those presented by the contributors to
this book.
The bridge between fundamental and technical analysis continues to
strengthen and the sophistication of each continues to develop. About a
century ago, Charles Dow, who was a journalist, entrepreneur, and technician,
created some of the world’s most popular equity indices, which are relied
on today by all market participants. About 30 years ago, the fundamental
term relative strength had only one meaning, until the publication of the
Relative Strength Index by established market technician J. Welles Wilder. The
xi
xii
Preface
theories of fundamental analysis and technical analysis are evolving together
and affecting each other at rates faster than ever before. Therefore, a goal of
this book is to properly document and share the gains of this evolution.
This book comprises contributions from five individuals who have spent
most of their careers, if not all, studying the financial markets through a
“technical” lens with the goal of identifying, developing, and implementing
effective trading and investment strategies. These strategies attempt to capitalize on the experiences in their careers and explain how existing market
actions will impact the future. Their methods are based on the existing body
of knowledge of Technical Analysis, and have evolved to support and appeal
to technical, fundamental, and quantitative analysts alike.
I view the contributors as accomplished market participants who do
everything they can to continually adapt to the modern-day securities exchange industry. They are constantly modifying and refining their methodic
approaches to the markets in order to achieve success, and I feel privileged to
be a part of the sharing of their strategies.
These five individuals bring with them a combined 150 years of market
experience. Their methods, at some point in time, were likely somewhat simplistic, such as the application of moving averages, overbought and oversold
momentum indicators, trending indicators, volume analysis, and so forth. We
could ask them to recall how they would use these studies, as I’m certain they
remember from their earlier days, but this has been done many times with
experienced market professionals.
Rather, Chapter 1 begins with the release of previously undisclosed evidence about the most preferred chart types and technical studies. It continues
into a lucid and simple summary of the essential elements of those chart types
and indicators. The following chapters continue with in-depth explanations
of the work of Julius de Kempenaer, Phil Erlanger, Cynthia Kase, Andrew
Kezeli, and Rick Knox. All of the chapters can be considered work that has
mostly never been seen before, and if seen, never in this much detail. Where
some parts of their work is considered intellectual property and therefore
proprietary, subjective discussions provide readers with challenging theories
and ideologies for their own use. Other parts certainly are not, and hopefully some, if not all, of the work contained in this book will be published
again and again, in the same way that Gerald Appel’s MACD indicator was
40 years ago.
Chapter 2 presents the work by Julius de Kempenaer on formalizing a
sector rotation strategy for world markets by tracking relative performance, the
momentum of, and implementing leading visualizations to hasten the process
Preface
xiii
of this traditional strategy. Chapter 3 presents the quantitative work by Phil
Erlanger on investing with seasonality and his four-step approach to trading
using Bias, Setups, Triggers, and Monitoring. Chapter 4 is a quantitative
and statistical approach by Cynthia Kase, who evolved from an engineer into
a market technician. She explains her trading strategies using a multitude
of tools that address challenging subjects such as appropriate stop levels,
adjusting for volatility, and the confluence of multiple timeframes. Chapter 5
by Andrew Kezeli discusses how Trade Angle Securities has incorporated the
advantages of the unorthodox yet extremely powerful Market Profile into a
suite of technical indicators that are applied to the more traditional bar chart.
Finally, Chapter 6 takes the work of Rick Knox, formerly a pit trader and
chart software developer, and emphasizes the importance of improving the
clarity of indicators through the use of color and a variety of types of technical
tools such as Elliott Waves, cycles, velocity, and also the agreement of multiple
timeframes. Additional information on the background of the contributors is
provided at the back of the book.
Most of the book’s contributing authors also maintain web sites, which
are mentioned throughout the text. If you’re interested in exploring these
valuable resources, go to any of the following:
www.bloomberg.com/professional/charts_launchpad/
/>www.erlanger.com/
www.kaseco.com/
www.atmstudies.com/
www.tradeangle.com
These and other useful resources are listed in the Recommended Reading
section.
Whether you’re a novice or a seasoned veteran in the subject of technical
indicators, there is much to be gained by reading this book. An associate
on a trading desk or a beginner in the subject of technical analysis has the
opportunity to learn about the universally accepted studies, how to use them,
and how the evolution of technical analysis has improved them. An analyst
or portfolio manager has the opportunity to discover tools that can bolster
his performance by studying the thought-provoking material on seasonality,
sector rotation, and market distributions. Technical analysts/strategists will
learn about groundbreaking tools and data visualizations to add to and possibly
replace some of their preferred indicators. Creative minds will be challenged to
xiv
Preface
brainstorm on which calculations, visual cues, and risk/reward ratios will work
the best for them when trading, investing, and creating their own indicators.
On behalf of all of those involved with the writing and editing of this
book, thank you for considering this work. We feel confident you will not be
disappointed and trust that this book will sharpen your investment strategies
and enhance the way you view the market.
Acknowledgments
I would like to express my appreciation for all who were involved in the
construction of this book and for their influence on my career.
This includes, but is not limited to, many of my colleagues at Bloomberg
LP in the Application Specialist, Sales, Product, Analytics, R&D, News, and
Markets groups. In addition, I thank the members and employees of the
Market Technicians Association, those who encouraged and supported me in
the quest to achieve the Chartered Market Technician (CMT) designation,
many of the clients of Bloomberg LP, and, of course, each of the contributors
to this book: Julius de Kempenaer, Phil Erlanger, Cynthia Kase, Andrew
Kezeli, and Rick Knox.
More specifically, I would like to thank Eugene Sorenson, Karsten Gaebele, and David Keller. You have been great mentors, colleagues, and friends
during this project and throughout my career. I look forward to our future
endeavors.
xv
New Frontiers in Technical Analysis: Effective Tools
and Strategies for Trading and Investing
by Paul Ciana
Copyright © 2011 Paul Ciana
CHAPTER 1
Evidence of the Most
Popular Technical
Indicators
Paul Ciana, CMT
Bloomberg LP
The application of various technical indicators is nothing new to the majority
of financial market participants. The opportunity to trade a moving average
cross or an overbought market is a frequent observation during normal market
hours worldwide. The challenge that many ponder is which technical indicators to use. In an effort to resolve that challenge, market participants wonder
what others are using. If this information can be identified and verified, market participants will likely monitor those indicators to understand what others
are thinking and seeing. Therefore, it might be possible to develop a trading
strategy based on the most popular technical indicators.
Although I cannot prove the latter as statistically true, this chapter reveals
a hierarchy of the most popular technical indicators on the Bloomberg Professional Service. Then it presents the indicators’ commonly accepted signals.
But first, it attempts to define what technical analysis represents; it would be
ill advised to discuss only indicators when technical analysis is much more
than that.
1
2
New Frontiers in Technical Analysis
Defining Technical Analysis
Sometimes it seems that the majority of market participants may be misled
about the broad scope of theories used in the application of technical analysis
when trying to understand and forecast the financial markets. My gut feeling
is that if we were to sample a random group of market participants to define
technical analysis, they would present terms such as price, moving averages,
charts, and oscillators. A simple Internet search confirmed my suspicions about
what words we would hear. Some of the definitions that can be easily found
do a good job of describing parts of the theory, while others should not be
read by a technician who lacks a sense of humor.
Three of the better definitions are:
1. Analysis of past price changes in the hope of forecasting future price
changes.
2. Analysis based on market action through chart study, moving averages,
volume, open interest, formations, and other technical indicators.
3. An approach to forecasting commodity prices that examines the patterns
of price change, rates of change, and changes in volume of trading and
open interest, without regard to underlying fundamental market factors.∗
Technical analysis offers much more than these definitions suggest. The
first is so generic it could be used to describe many fields of analysis. It suggests
market participants study prices and fails to elaborate on the variety of data
types that can be analyzed. The second mentions market action, a common
term used in describing technical analysis, but then repeats itself by listing the
data sets that represent market action. It assumes that most of the methods
of a technical analyst are focused on technical indicators and therefore it does
not elaborate on the variety and depth of the theories in this field of study.
The third suggests that technical analysis is used in the commodity markets,
which is true, but the application of technical analysis is not restricted to only
the commodity markets. Technical analysis can be applied to nearly all types
of financial markets.
The methods of a technician span a wide array of theories and use countless different tools to strategize, quantify, and discuss the financial markets in
ways that other types of analyses don’t or can’t. One of my goals in writing this
∗
Definition one from wordnetweb.princeton.edu/perl/webwn; definition two from
www.worldwidemoneyexchange.com/terminology.html; and definition three from
www.lind-waldock.com/education/glossary/technical_analysis_terms.shtml.
Evidence of the Most Popular Technical Indicators
3
chapter is to create a one-sentence definition that broadens the scope of the
known definitions. It has proved to be very challenging to come up with one
sentence that defines technical analysis in its entirety. I believe this is a debate
for the entire industry to continuously weigh in on, especially as technical
analysis evolves; furthermore, I do not mean to suggest that any one definition
would ever be universally acceptable. At present, and with the input of a few
friends, I lean toward the following definition:
Technical analysis is the extraction of information from market data into
objective visualizations through the use of mathematics with an emphasis
on investor behavior and supply and demand to explain the current and
anticipate the future path of the financial markets.
This definition suggests that technical analysis comprises the following
five attributes:
1. Market data: Represents a variety of data sets that includes the most
frequently used ones such as price, volume, and open interest, but
does not exclude data sets such as volatility, ticks, ratios, and dividend
yields.
2. Objective visualizations: A preference for analyzing information in a chart,
but visualizations could be more than a chart, such as a figure, table, scatter
plot, or query of results.
3. Use of mathematics: The application of measurements and calculations to
measure the market actions of an individual security or a group of securities.
4. Emphasis on investor behavior and supply and demand: We have a bias for
identifying rational and irrational market actions and look for imbalances
in the availability or desire for a security.
5. Explain the current and anticipate the future: We are attempting to understand what the market is telling us about itself to estimate where it may go
in the future.
To further explain the definition, we will summarize the three premises of
technical analysis (see Figure 1.1) and explain some of the most popular tools
(certainly not all) used for this method of analyzing the financial markets.
The first principle states that market actions discount everything. This
premise suggests that all publicly available information—such as companyspecific news, political changes, weather, and so forth—is already priced into
the current value of a security. Therefore we do not necessarily need to know
why something is happening; we need only to understand the reaction of
4
FIGURE 1.1
New Frontiers in Technical Analysis
Defining Technical Analysis Principles
What Is
Technical Analysis?
The Study of
Market Actions
Three Premises
Market actions
discount everything
History repeats itself
Prices move in trends
investors to what is happening. If the reaction is positive, market participants
will push markets higher. If the reaction is negative, market participants will
push markets lower. We then employ a host of tools to decipher the impact
of that action on the existing trend.
The second principle states that prices move in trends. This relates to Isaac
Newton’s first law of motion. It suggests that an object in motion remains in
motion until acted upon by an equal or stronger force. This force, depending
on its strength, can change the direction of motion from its prior path. In
technical analysis, this can be thought of as an event or group of events being
discounted into the price of a security, causing price to change direction.
The third principle is that history repeats itself —I can still hear my high
school history teacher’s voice as he quoted, “Those who do not learn history are
doomed to repeat it.” This principle suggests that as the dominant generation
or the largest group of market participants transitions out of the financial
markets, the incoming generation does not learn or receive enough of the
previously accumulated information. Therefore we have an inherent bias to
repeat many of the same investment and trading decisions, both correct and
incorrect, as did previous generations. Some of this tendency to repeat history
is represented by price patterns that form on the chart (i.e., a triangle or head
and shoulders).
Now that we have a basis for what technical analysis is, we can discuss
the tools that a technician uses. Figure 1.2 is a diagram presenting many of
5
Evidence of the Most Popular Technical Indicators
FIGURE 1.2
Methods/Theories Used in the Application of Technical Analysis
Momentum
Trending
Relative Performance
Fibonacci/GANN
Technical Studies
Trend Lines
Diversification
The Study of Market Actions
Dow Theory
Price Patterns
Chart Types
Cycle Theory
Data Gathering
Line & Ratios
Bar Charts
Candle Patterns
Contrary
Opinion
C
t
O i i
Seasonality
S
lit
Point & Figure
Market Profile
Market Sentiment
Renko Charts
Psychology
Constant Volume
Equi-Volume
Elliott Wave
Constant Tick
Quantification
Kase Bars
the theories and tools that a technician explores to perform an analysis of the
financial markets, but it is certainly not inclusive of all the topics. The goal
of this figure is to showcase the broad scope of the theories that encompass
technical analysis. There are many books that go into detail about these and
other topics. Please see the Recommended Reading section at the back of this
book for more information.
The remainder of this chapter will address what the most popular chart
types and technical studies are on the Bloomberg Professional Service. We
will start with a description of the popular chart types and then break down
their popularity. Then we discuss the popularity of technical indicators and
break down their applications to the financial markets.
Defining Chart Types
Rarely does any market participant make an investment decision without
observing the current trend. By simply looking at a line chart, a market
participant can see upward, downward, or sideways movements. The work of
6
New Frontiers in Technical Analysis
FIGURE 1.3
Line Chart Showing Stock Price, U.S. GDP, and P/E Ratio
150
International Business Machines Corp.
100
50
4.0
2.0
0.0
–2.0
–4.0
US GDP Chained CYOY
P/E Ratio - IBM
2001
2002
2003
2004
2005
2006
2007
2008
2009
20
15
10
2010 2011
a technician starts with price, and to look at price we use many different types
of charts, such as those listed in Figure 1.2. Although this list is plentiful,
it is far from being all-inclusive. Throughout this book, we will familiarize
ourselves with the line, bar, candle, log, and intraday charts and identify their
ranks in popularity among market participants. Later, we will do the same for
the most-preferred technical indicators.
A line chart is a very elegant and simple type of chart to look at. It
provides convenience for faster analysis because it shows the overall direction
of trend. It is typically used by an economist analyzing economic data sets,
a fundamental analyst scanning a list of securities for performance changes
and fundamental trends, and overall very long-term analysis. For example, it
could be a historical look at an economic release like gross domestic product
(GDP), the price/earnings (P/E) ratio of a stock, or the closing price of a
security. Figure 1.3 displays these data sets with added line-chart features
that help in differentiating data sets from one another. The middle panel has
markers on GDP emphasizing where the closing value was and the bottom
panel has shading below the line (P/E ratio) to emphasize the slope of the line.
A bar chart is slightly more complex than a line chart in that it offers
three more data points per occurrence, when such data exists. It shows the
open, high, and low price in addition to the last or closing price.
A candle chart is similar to a bar chart in that it displays the same data—the
open, high, low and closing prices—but it does so in a more descriptive and
artistic fashion to allow for a quicker analysis and a clearer understanding of
price movement. Figure 1.4 displays all three chart types. The candle chart
differs the most because of the “body,” or the rectangular shape in the middle,
representing the opening and closing price for a period of time. Typically,
7
Evidence of the Most Popular Technical Indicators
FIGURE 1.4
Three Types of Charts: Line, Bar, and Candle
Line
Bar
Candle
High
High
Close
Close
Open
Open
Low
Low
High
Open
Close
Open
Close
Low
Low
when this body is hollow, it represents an up period. When it is dark or filled
in, it represents a down period.
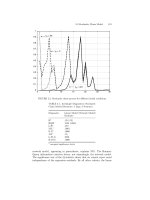
Figure 1.5 is a historical representation comparing all three chart types
and shows an example of how the clarity of a candle chart can offer an
advantage in identifying more information faster than other chart types. Here
we can quickly see that 13 of the 18 trading days in February were up-days
(or hollow-bodied candles) and the other six were down-days (or dark-bodied
candles).
A logarithmic chart is designed to represent the percent change between
price increments on the y-axis. As the values on the y-axis get larger, the
distance between them will shrink to a distance that is relative to the percentage change. For example, a security that goes from $10 to $20 has experienced a $10 change or an increase of 100 percent. A security that goes
from $100 to $110 has also experienced a $10 change but only a 10 percent
increase. Therefore the vertical distance on the y-axis should be greater for the
100 percent increase and smaller for the 10 percent increase. A good rule of
thumb is to consider a log chart, in addition to an arithmetic chart, when the
value has changed about 30 percent or more and always as an alternative for
long-term analysis.
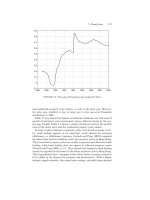
Figure 1.6 displays the price of the S&P 500 from the lows of March
2009 to March 2011, when price gained about 100 percent. The top panel
8
Jan 14
Jan 21
Jan 31
Feb 7
2011
Span 18
Feb 14
Span 18
Span 18
Feb 22
Feb 28
A Historical Comparison of a Line, Bar, and Candle Chart of the S&P 500 Index
Jan 7
FIGURE 1.5
Mar 8
Mar 15
1250
1279.20
1300
1250
1350
1279.20
1300
1350
1279.20
1300
9
Mar
+101.57%
Jun
2009
Sep
Dec
Mar
Trend Line Analysis Showing Arithmetic versus Log Scale Charts
+101.57%
FIGURE 1.6
Jun
2010
Sep
Dec
2011
Mar
700
800
1000
900
1500
1200
1100
1000
900
800
700
1300
10
New Frontiers in Technical Analysis
is an arithmetic chart, showing equal price increments on the y-axis, and the
bottom panel is a log chart, which adjusts the distance between increments
on the y-axis to correspond with percentage change. In the top chart, price
is about 50 points above the upward-sloping trend line. In the bottom chart,
price is already starting to trade below the upward-sloping trend line. This
difference in the display of market actions highlights why it is important to
consider both chart types.
The last chart type to introduce is the intraday chart. This chart is used
primarily by traders who have a short investment horizon or holding period,
in order to track the current day or past few days of price movement. It
provides a quick glimpse into what is happening right now for the value of a
security and is designed to update in real time. An example of a 10-minute
bar chart for the past three days is displayed in Figure 1.7. Each bar displays
the open, high, low, and close for that 10-minute period of market activity.
Evidence of Chart Type Popularity
Now that we are familiar with the line, bar, candle, log, and intraday charts,
we can discuss the preference of these chart types by market participants
who analyze the financial markets through interaction with the Bloomberg
Professional Service.
The measurable sample size of these regions is approximately 44 percent
in the Americas, 38 percent in Europe, 12 percent in Asia, and 2 percent in
the Middle East and South Africa (MESA). In other words, of a hypothetical
100 market participants, 44 were in the Americas, 38 in Europe, 12 in Asia,
and 2 in MESA.
Figure 1.8 displays the average chart-type preference of market participants from 2005 to 2010. This reveals, on average, that the line chart is
preferred about half the time, the bar chart about one quarter of the time,
the candle chart about one fifth of the time, and that the log chart is rarely
preferred.
Figure 1.9 displays the average preference for historical charts and intraday
charts by market participants from 2005 to 2010. This reveals, on average,
that the historical chart is chosen more than twice as often as the intraday
chart, or about 69 percent of the time, while the intraday chart is preferred
about 31 percent of the time.
Table 1.1 reveals the average preference for each year of the statistics
shown in Figure 1.8 and 1.9. This data suggests that the preference for line
charts is slowly growing, the preference for bar charts is gradually declining,
11
10:00
FIGURE 1.7
12:00
14:00
16 Mar 2011
10:00
Three-Day, Ten-Minute Bar Chart
12:00
14:00
17 Mar 2011
10:00
12:00
14:00
18 Mar 2011
8.50
8.55
8.60
8.65
8.70
8.75
8.80
8.86
8.85
12
New Frontiers in Technical Analysis
FIGURE 1.8
Average Chart Type Preference from 2005 to 2010
Log = 3%
Candle = 22%
Line = 49%
Bar = 27%
FIGURE 1.9
Average Historical and Intraday Chart Type Preferences
Intraday = 31%
Historical = 69%
TABLE 1.1
Yearly Averages of Chart Types and Chart Periods
2005
2006
2007
2008
2009
2010
Line
46%
47%
49%
52%
50%
50%
Bar
29%
29%
27%
26%
25%
25%
Candle
22%
22%
21%
20%
22%
22%
Log
2.9%
2.7%
2.5%
2.6%
3.6%
3.1%
Historical
74%
74%
71%
67%
65%
65%
Intraday
26%
26%
29%
33%
35%
35%