CNS AND MISCELLANEOUS INTRACRANIAL AND INTRASPINAL NEOPLASMS pot
Bạn đang xem bản rút gọn của tài liệu. Xem và tải ngay bản đầy đủ của tài liệu tại đây (114.41 KB, 14 trang )
ICCC IIICNS AND MISCELLANEOUS INTRACRANIAL AND INTRASPINAL NEOPLASMS
51
National Cancer Institute
SEER Pediatric Monograph
HIGHLIGHTS
Incidence
♦ The CNS malignancies represented 16.6% of all malignancies during childhood
(including adolescence). CNS cancer as a group was the second most frequent
malignancy of childhood and the most common of the solid tumors. In the US
approximately 2,200 children younger than 20 years of age are diagnosed annually
with invasive CNS tumors.
♦ Astrocytomas accounted for 52% of CNS malignancies, PNET comprised 21%,
other gliomas 15% and ependymomas an additional 9% (Figure III.1).
♦ Unlike adults and older children, young children have a relatively high occurrence
of malignancies in the cerebellum and the brain stem. In fact, in children younger
than 10 years of age, brain stem malignancies were nearly as common as cerebral
malignancies, and cerebellum malignancies were far more common than cerebral
malignancies (Figure III.2).
♦ The incidence of invasive CNS tumors was higher in males than females and
higher among white children than black children (Figure III.5).
♦ The average annual incidence of CNS cancer varied only slightly by age of diagno-
sis from infancy (36.2 per million) through age 7 years (35.2 per million). From
age 7 to 10, a 40% drop in the incidence rate (to 21.0 per million) was observed.
CNS cancer rates were fairly consistent among children aged 11 through 17 years,
until another substantial decrease occurred at age 18 (Figure III.6).
♦ The increase in CNS cancer rates in the past two decades has been the subject of
numerous reports. One concern is that changes in environmental exposures may
be responsible for the increasing incidence rates, although epidemiologic evidence
to support this hypothesis currently is lacking. An alternative explanation is that
improvements in diagnostic technology and case ascertainment may be
contributing to the increasing trend.
Survival
♦ In general, children with CNS cancer do not share the favorable prognosis of those
with many other common pediatric neoplasms.
♦ Very young children with CNS cancer, especially infants with ependymoma or
PNET, had low survival rates (Table III.2).
Risk factors
♦ There is no specific risk factor that explains a substantial proportion of brain
tumor occurrence, but there are a couple of factors that explain a small proportion
(Table III.3).
INTRODUCTION
Since most of the neoplasms described
in this chapter are in the central nervous
system, the abbreviation CNS will be used
to refer to neoplasms that originate in the
brain, other intracranial sites such as the
pituitary or pineal glands, and the spinal
cord. In the US, approximately 2,200
children and adolescents younger than 20
years of age are diagnosed with malignant
central nervous system tumors each year.
Over 90 percent of primary CNS malignan-
cies in children are located within the
James G. Gurney, Malcolm A. Smith, Greta R. Bunin
ICCC III CNS
52
National Cancer Institute
SEER Pediatric Monograph
rates for the CNS germ cell malignancies
from 1990-95 were 0.2 per million children
younger than 15 years of age, and 1.9 per
million children younger than 20 years of
age. Fifty-three additional tumors were
excluded because they occurred outside the
brain, intracranium and spinal cord.
It also should be noted that data
reported here are comprised solely of CNS
tumors that are classified as primary and
malignant. Primary CNS neoplasms are
tumors that originated in the central
nervous system. Thus, they exclude cancer
that developed in some other location in the
body and then spread to the CNS. Like-
wise, CNS tumors classified as benign or
with uncertain behavior (nonmalignancies)
are not routinely collected by SEER areas,
and thus are not included in this report.
The pathological distinction between malig-
nant and nonmalignant tumors of the CNS
is not always consistent with clinical behav-
ior, particularly for intracranial tumors.
Depending on the location and the size of
the tumor, some intracranial tumors that
are classified as benign can have a destruc-
tive clinical course (eg. craniopharyngioma).
In contrast, some tumors classified as
malignant may require no treatment and
have little clinical significance (eg. pilocytic
astrocytomas of the optic pathway). Al-
though all central registries will include
malignant neoplasms in their case ascer-
tainment, when comparing CNS incidence
rates across cancer surveillance systems it
is necessary to determine whether a given
registry also includes nonmalignant tu-
mors. An analysis of data from the Central
Brain Tumor Registry of the United States
(a compilation of data from population-
based registries that include case ascertain-
ment of nonmalignant CNS tumors)
showed that the incidence of only malig-
nant CNS tumors underestimates the
incidence of both malignant and non-
malignant CNS tumors by approximately
28% [4].
brain. This report only includes malignant
CNS tumors.
Classification system
CNS tumors are heterogeneous in
regards to histology and clinical course.
Because of the many relatively similar
histopathological types and their rarity, it is
necessary for epidemiologic purposes to
group CNS tumors into rather broad histo-
logic categories. There are several classifi-
cation systems that are used for describing
CNS tumors and no system has yet
emerged as the definitive gold standard
[1,2]. For most of this monograph, malig-
nancies are grouped according to the Inter-
national Classification of Childhood Cancer
(ICCC) system [3]. There are a few minor
discrepancies within the ICCC system for
CNS tumors, however, that somewhat
compromise accurate comparisons with
other published work. Most notable, intrac-
ranial neuroblastoma and pineoblastoma,
which, along with medulloblastoma are
generally considered primitive neuroecto-
dermal tumors (PNET), are not included
with the PNET category of the ICCC for
CNS. For the descriptive analysis that
follows, we modified the ICCC groupings for
CNS tumors in the following manner:
“Other specified intracranial and intraspi-
nal neoplasms excluding pineoblastoma
(IIIe)” and “Unspecified intracranial and
intraspinal neoplasms (IIIf)” were com-
bined into one category, called ‘other CNS’;
the “Ependymoma (IIIa)” category was not
changed; the “PNET (IIIc)” category was
expanded to include intracranial neuroblas-
toma (these were also reported with ICCC
IV) and pineoblastoma. Finally, the ICCC
system places intracranial and intraspinal
germ cell malignancies within the germ cell
category, rather than the CNS tumor
category. We chose to follow the ICCC
system for CNS germ cell tumors, thus we
did not include intracranial and intraspinal
germ cell tumors in this chapter (see ICCC
group X). The average annual incidence
ICCC IIICNS
53
National Cancer Institute SEER Pediatric Monograph
INCIDENCE
Unless otherwise indicated, the discus-
sion on incidence that follows will pertain
to children younger than 20 years of age
and only malignant tumors. For the 21-
year period of 1975-95, there were 4,945
primary malignant tumors of the CNS
diagnosed among children in SEER areas.
This represented 16.6% of all malignancies
during childhood (including adolescence).
CNS cancer as a group was the second most
frequent malignancy of childhood and the
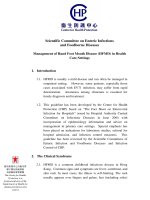
most common of the solid tumors. Astrocy-
tomas accounted for 52% of CNS malignan-
cies, PNET comprised 21%, other gliomas
15%, and ependymomas an additional 9%
(Figure III.1).
The incidence rates by location within
the brain and other CNS sites as a function
of age are shown in Figure III.2. Unlike
adults and older children, who have higher
rates in the cerebrum, young children have
a relatively high occurrence of malignancies
in the cerebellum and the brain stem. In
fact, in children between the ages of 5 and
9, brain stem malignancies were nearly as
common as cerebral malignancies, and
cerebellum malignancies were far more
common than cerebral malignancies. The
pattern shifted among children between the
ages of 10-19, in that the incidence of both
brain stem and cerebellar cancers de-
creased while cerebral malignancies in-
creased slightly. The “other” brain site
group included the ventricles, where
ependymomas generally develop, and
malignancies with brain sites not otherwise
specified. The “Other CNS” category in-
cludes malignancies of the meninges,
cranial nerves and spinal cord.
Figure III.1: Percent distribution of malignant CNS
tumors by age and histologic group, all races
both sexes, SEER, 1975-95
49.6
22.9
15.4
9.3
2.7
52.2
20.8
15.5
8.6
3
Astrocytomas
PNET
Other gliomas
Ependymomas
Other CNS
010203040506070 0 10203040506070
<15 years
<20 years
Percent of total CNS cancer
Figure III.2: Malignant CNS tumor age-specific
incidence rates by anatomic site and age
all races, both sexes, SEER, 1975-95
4.7
5.9
2.8
1.7
5.8
5.9
6.8
7
9.3
9.7
5.7
3.7
8.8
5.9
4.5
4
2.6
1.9
1.7
1.6
<5
5-9
10-14
15-19
Age (in years) at diagnosis
0123456789101112
Average annual rate per million
Brain Stem
Cerebrum
Cerebellum
Other Brain
Other CNS
ICCC III CNS
54
National Cancer Institute
SEER Pediatric Monograph
Age-specific incidence
Incidence rates by single year of age
are presented in Figure III.3.
1
The average
annual incidence of CNS cancer varied only
slightly by age of diagnosis from infancy
(36.2 per million) through age 7 years (35.2
per million). From age 7 to 10, a 40% drop
in the incidence rate (to 21.0 per million)
was observed. CNS cancer rates were
fairly consistent among children aged 11
through 17 years, until another substantial
decrease occurred at age 18.
The incidence of astrocytomas peaked
at age 5 (20.7 per million) and a second
peak occurred at age 13 (19.7 per million).
PNET rates were fairly steady from infancy
through age 3 years (ranging from 11.6 to
10.2 per million) and then steadily declined
thereafter. Rates of ependymomas were
highest through age 3 years, with the age
of peak incidence occurring during the
second year of life (8.6 per million). Among
children aged 5-14, ependymomas are very
rare, averaging only 1.4 per million.
Although in our data the age-specific
rates for black children were fairly unstable
because of small numbers of cases (295
cases from 1986-94), the greatest difference
in rates between whites and blacks was
observed during the first year of life (47.8
vs. 18.7 per million, respectively) (Figure
III.4). In the second year of life, rates
among whites decreased from the first year,
Figure III.3: Malignant CNS tumor age-specific
incidence rates, all races, both sexes
SEER, 1986-94
)
)
)
)
)
)
)
)
)
)
)
)
)
)
)
)
)
)
)
)
&
&
&
&
&
&
&
&
&
&
&
&
&
&
&
&&
&
&
&
(
(
(
(
(
(
(
(
(
((
(
(
(
(
(
(
(
(
(
$
$
$
$
$
$
$
$
$
$
$
$
$
$
$
$
$
$
$
$
#
#
#
#
#
#
#
#
#
#
#
#
#
#
#
#
##
#
#
0 1 2 3 4 5 6 7 8 9 10 11 12 13 14 15 16 17 18 19 20
Age (in years) at diagnosis
0
5
10
15
20
25
30
35
40
45
Average annual rate per million
All CNS
Astrocytomas
PNET
Other gliomas
Ependymoma
#
$
(
&
)
Figure III.4: Malignant CNS tumor age-specific
incidence rates by race, both sexes
SEER, 1986-94
'
'
'
'
'
'
'
'
'
'
'
'
'
'
'
'
'
'
'
'
+
+
+
+
+
+
+
+
+
+
+
+
+
+
+
+
+
+
+
+
01234567891011121314151617181920
Age (in years) at diagnosis
0
5
10
15
20
25
30
35
40
45
50
55
Average annual rate per million
White
Black
+
'
1
Enumeration of the population at risk by single years of age was
available only for the census years 1980 and 1990. The US Bureau
of the Census provides intercensal population estimates by 5-year
age groups, but not by single years of age. Therefore, the
population estimates for 1980 were used in rate calculations for
cases diagnosed from 1976-84 and the 1990 estimates were used for
cases diagnosed from 1986-94.
ICCC IIICNS
55
National Cancer Institute SEER Pediatric Monograph
while rates in blacks increased substan-
tially. To a degree, this could suggest a
pattern in which whites were diagnosed
earlier than blacks (on average) for the
CNS malignancies that occur early in life,
although we are aware of no other evidence
that supports this speculation.
Sex-specific incidence
As will be discussed below, brain cancer
incidence rates in children have increased
in SEER areas over the past 2 decades. For
this reason, the following CNS cancer
incidence rates are reported for the time
period 1990-95, rather than 1975-95, to
reflect recent patterns. The rates that
follow were adjusted to the 1970 US stan-
dard million population. The incidence rate
of primary CNS malignancies was 27.2 per
million children younger than 20 years of
age (if intracranial germ cell malignancies
are included, the rate was 29.1 per million).
Males (30.0 per million) had a 24% higher
incidence rate relative to females (24.2 per
million). Figures III.5 and III.6 illustrate
the sex-specific rates by histologic groups of
children younger than 20 years of age and
younger than 15 years of age, respectively.
A clear male preponderance for both PNET
and ependymomas was evident, but rates
for males and females were similar for the
other histologic groups.
Black-white differences in incidence
White children (28.5 per million) had
an 18% higher average CNS incidence rate
compared with black children (24.2 per
million). Figure III.7 depicts overall inci-
Figure III.5: Malignant CNS tumor age-adjusted*
incidence rates by histologic group and sex
age <20, all races, SEER, 1990-95
30
14.8
7.3
4.5
3
0.5
24.2
13.5
4.2
4.4
1.5
0.6
All CNS
Astrocytomas
PNET
Other gliomas
Ependymomas
Other CNS
0 4 8 12162024283236
Average annual rate per million
Males
Females
*Adjusted to the 1970 US standard population
32.7
15.7
8.6
4.5
3.5
0.5
26.8
14.5
5
5
1.8
0.4
All CNS
Astrocytomas
PNET
Other gliomas
Ependymomas
Other CNS
0 4 8 12162024283236
Average annual rate per million
Males
Females
*Adjusted to the 1970 US standard population
Figure III.6: Malignant CNS tumor age-adjusted*
incidence rates by histologic group and sex
age <15, all races, SEER, 1990-95
ICCC III CNS
56
National Cancer Institute
SEER Pediatric Monograph
dence rates by sex for white children, black
children, and all children combined. It is
evident that the racial difference in CNS
rates was primarily concentrated among
males. There was only a slightly higher
CNS cancer incidence rate among white
compared with black females (8%), while
the racial difference in rates for males was
somewhat more pronounced (26%).
TRENDS
The observation that CNS cancer
incidence in children appears to have
increased in the past two decades has been
the subject of numerous previous reports
[5-8]. There is considerable debate regard-
ing the possible reasons for the apparent
trend. One concern is that changes in
environmental exposures may be respon-
sible for the increasing incidence, although
epidemiologic evidence to support this
hypothesis currently is lacking [9]. An
alternative explanation is that changes in
reporting due to improvements in diagnos-
tic technology and case ascertainment may
be contributing to the increasing trend.
Figure III.8 illustrates the increase in
incidence rates of CNS cancer for the years
1975-95 for children younger than 15 years
of age. Based on a model using a constant
rate of increase in incidence over this
period, the estimated annual percentage
change (EAPC) was +1.5% (continuous
green line in Figure III.8). Smith et al [5]
recently evaluated CNS trends for children
in the United States from SEER data using
a more sophisticated statistical modeling
technique. They demonstrated that the
incidence of CNS malignancies did not
increase steadily from 1973 to 1994, but
rather “jumped” to a steady, but higher rate
after 1984-85. When the same methodol-
ogy was applied to the younger than 15
year old age group described in this chapter
for the years 1975 to 1995, this “jump
model”, with the optimal change point from
lower to higher incidence occurring after
1985, produced a significantly better fit
than the model using a constant linear rate
Figure III.7: Malignant CNS tumor age-adjusted*
incidence rates by race and sex
age <20, all races, SEER, 1990-95
30
31.5
25
24.2
25.3
23.4
All Races
White
Black
0 4 8 1216202428323640
Average annual rate per million
Males
Females
*Adjusted to the 1970 US standard population
Figure III.8: Temporal trends in malignant CNS tumor
age-adjusted* incidence rates, age <15
all races, both sexes, SEER, 1975-95
)
)
)
)
)
)
)
)
)
)
)
)
)
)
)
)
)
)
)
)
)
75 77 79 81 83 85 87 89 91 93 95
Year of diagnosis
0
5
10
15
20
25
30
35
40
Average annual rate per million
Incidence
1975-95
1975-85
1986-95
)
*Adjusted to the 1970 US standard population
ICCC IIICNS
57
National Cancer Institute SEER Pediatric Monograph
of increase (p = 0.003). The EAPC from
1975-84 was –0.1% (blue line in Figure
III.8) and for 1986-95 the EAPC was also
–0.1% (red line in Figure III.8). The timing
of the jump in incidence is coincident with
the wide-scale availability of magnetic
resonance imaging (MRI) in the United
States [5]. This observation, combined with
the absence of any jump in CNS cancer
mortality during the same period, lends
support to the contention that improved
diagnosis and reporting during the 1980’s is
largely responsible for the temporal trends
in CNS incidence rates that have been
observed since the 1970s. Whether the
relatively stable rates of childhood CNS
cancer observed over the past decade in the
US will continue, however, remains to be
seen.
SURVIVAL
Although survival differs by histology,
behavior, size and location of the malig-
nancy, in general children with CNS cancer
do not share the favorable prognosis of
those with many other common pediatric
neoplasms, such as acute lymphoblastic
leukemia. Additionally, for children who do
survive CNS cancer, long term morbidity
can be substantial. Table III.1 provides 5-
year relative survival probabilities by
histologic group within 2 time periods.
Survival probability improved
somewhat over the two time periods. Nev-
ertheless, other than astrocytomas, many of
which were low grade malignancies such as
Figure III.9: Total malignant CNS tumor 5-year relative
survival rates by sex, race, age and time period
SEER (9 areas), 1975-84 and 1985-94
60
58
61
60
53
54
59
62 62
65
67
63
66
58
56
64
70
77
Total Male Female White Black <5 5-9 10-14 15-19
0
20
40
60
80
100
Percent surviving 5 years
1975-84
1985-94
Sex Race
Age
juvenile pilocytic astrocytomas, survival
probability was less than 60%. While there
were only minimal differences in survival of
CNS cancer by sex and race, age was an
important factor. Table III.2 provides 5-
year relative survival for 1986-94 according
to age and histologic groups.
For all CNS cancer combined, survival
probability increased with increasing age.
Very young children with CNS cancer,
especially infants with ependymoma or
PNET, were at particularly high risk of
Table III.2: 5-year relative survival rates for
CNS cancer by type and age group
all races, both sexes, SEER, 1986-94
ICCC Group <1 1-4 5-9 10-14 15-19
All CNS
Cancer
45% 59% 64% 70% 77%
Astrocytoma
69 79 70 75 75
Other Glioma * 51436479
Ependymoma
25 46 71 76 *
PNET
19 46 69 57 75
* less than 20 cases.
Table III.1: 5-year relative survival rates for
CNS by type and time period
age <20, all races, both sexes
SEER 1975-84 and 1985-94
ICCC Group 1975-84 1985-94
All CNS Cancer 60% 65%
Astrocytoma 70 74
Other Glioma 47 57
Ependymoma 39 56
PNET 52 55
ICCC III CNS
58
National Cancer Institute
SEER Pediatric Monograph
Figure III.11: Astrocytoma 5-year relative survival rates
by sex, race, age and time period, SEER (9 areas) 1975-84 and 1985-94
70 70 70
71
62
73
75
70
62
74
76
72
75
69
77
70
75 75
Total Male Female White Black <5 5-9 10-14 15-19
0
20
40
60
80
100
Percent surviving 5 years
1975-84
1985-94
Sex
Race
Age
Figure III.10: Ependymoma 5-year relative survival rates
by sex, race, age and time period, SEER (9 areas), 1975-84 and 1985-94
39
38
40
42
29
56
58
53
57
51
42
71
Total Male Female White Black <5 5-9 10-14 15-19
0
20
40
60
80
100
Percent surviving 5 years
1975-84
1985-94
Sex
Race
Age
# - <25 cases - rate not shown
###
#
ICCC IIICNS
59
National Cancer Institute SEER Pediatric Monograph
Figure III.12: PNET 5-year relative survival rates
by sex, race, age and time period, SEER (9 areas), 1975-84 and 1985-94
52
46
60
53
52
48 48
57
63
55
58
51
57
54
40
69
57
75
Total Male Female White Black <5 5-9 10-14 15-19
0
20
40
60
80
100
Percent surviving 5 years
1975-84
1985-94
Sex
Race
Age
Figure III.13: Other gliomas 5-year relative survival rates
by sex, race, age and time period, SEER (9 areas), 1975-84 and 1985-94
47
49
46
47
49
44
39
48
63
57
61
53
62
41
55
43
64
79
Total Male Female White Black <5 5-9 10-14 15-19
0
20
40
60
80
100
Percent surviving 5 years
1975-84
1985-94
Sex
Race
Age
ICCC III CNS
60
National Cancer Institute
SEER Pediatric Monograph
Table III.3: Current knowledge on causes of childhood brain tumors
Exposure or Characteristic Comments References
Sex Incidence of medulloblastoma and ependymomas in males is higher than
in females. For other types of brain tumors, there is little difference
between males and females.
10
Therapeutic doses of ionizing
radiation to head
Children treated for tinea capitis experienced 2.5-6-fold increased risk.
Currently, those at risk are children treated with radiation to the head for
leukemia or a previous brain tumor.
11,12
Neurofibromatosis, tuberous
sclerosis, nevoid basal cell
syndrome, Turcot syndrome, Li-
Fraumeni syndrome
Children with these genetic conditions have a greatly increased risk of
brain tumors, for example, 50-fold for neurofibromatosis and 70-fold for
tuberous sclerosis. Together, these conditions account for less than 5% of
all childhood brain tumors.
10,13,14,28
Maternal diet during pregnancy Frequent cured meat consumption has been consistently associated with a
1.5-2.0 fold increased risk. However, it is unclear whether cured meats or
another dietary factor are responsible, since most aspects of diet have not
yet been studied.
10,13,15-17
Parent or sibling with brain
tumor
Having a sibling or parent with a brain tumor has usually been associated
with a 3-9 fold increased risk. It may be that the excess risk is explained
completely by the specific genetic conditions listed above.
10,13,17,18
Family history of bone cancer,
leukemia or lymphoma.
The increased risk seen in some studies may be explained by the Li-
Fraumeni syndrome.
10,13,22,23,
24
Electromagnetic fields A small increase in risk has been observed in some studies, but not most. 10,13,19,29,
30
Products containing N-nitroso
compounds: beer, incense,
make-up, antihistamines,
diuretics, rubber baby bottle and
pacifier nipples
The data are inconsistent; associations seen in one study have generally
not been reported in later studies.
10,13,21
Father’s occupation and related
exposures
Many associations have been reported, but few have been replicated:
aircraft industry, agriculture, electronics mfg., petroleum industry,
painter, paper or pulp mill worker, printer, metal-related occupation,
exposure to paint, ionizing radiation, solvents, electromagnetic fields.
10,13,25
Pesticides There has been little focused research on this topic. Two small studies
suggest an association with use of no-pest strips.
10,13,20,31
History of head injury This is difficult to study because of the rarity of serious head injury and
the possibility that mothers of children with brain tumors are more likely
than control mothers to recall minor head injuries.
10,13,26
Family history of epilepsy or
seizures
The data are inconsistent. One study suggests that the effect of family
history of seizures may differ by type of brain tumor and/or type and
circumstances of seizures.
13,18,27
Family history of mental
retardation
Increased risk observed in one study of adults and one of children. 13
Note that the majority of these risk factors have been reviewed recently in references 10 and 13; only selected
references are presented for additional reading.
Factors for which evidence
is suggestive but not conclusive
Known risk factors
Factors for which evidence
is inconsistent or limited
ICCC IIICNS
61
National Cancer Institute SEER Pediatric Monograph
mortality. Relative to younger children,
adolescents with CNS cancer tended to fare
well (Figures III.9-III.13).
RISK FACTORS
Table III.3 presents a general sum-
mary of the current knowledge on causes of
brain cancer in children. To date, there is
no specific risk factor known to explain a
substantial proportion of brain tumor
occurrence. Some hereditary conditions
that are clearly associated with increased
susceptibility to CNS cancer in children
include neurofibromatosis type 1, nevoid
basal cell syndrome, and tuberous sclerosis.
These diseases are rare, however, and not
all children with genetic predispositions go
on to acquire cancer. Although a somewhat
increased risk has been observed when a
sibling or parent has had a brain tumor, the
association with family history is not strong
or consistent. Thus, from a population
perspective, known inherited genetic factors
explain only a small percentage of child-
hood CNS cancer incidence. The same can
be said for many other exposures that have
been studied. While therapeutic doses of
ionizing radiation to the head are defini-
tively known to increase the risk of brain
tumors in children, this exposure is largely
historical in nature because therapeutic
head x-rays are now used very sparingly
and with much greater caution than in the
past. There is some evidence that certain
dietary components during pregnancy may
either raise or lower risk, but the relevant
aspects have not yet been clarified. For
exposures with inconsistent or limited data
that are listed in the table, it is not yet
possible to say whether they influence risk.
We know a few factors that do not appear
to increase a child’s risk of developing a
brain tumor, including passive cigarette
smoke exposure, electric blanket use, and
ultrasound testing during pregnancy. The
difficulty in identifying CNS cancer risk
factors may stem in part from studying all
childhood brain tumors as a single entity
when many different histologic subtypes
occur. The rarity of any specific histologic
type makes it very difficult to accrue
enough cases for epidemiologic study.
SUMMARY
Cancer of the brain and central ner-
vous system comprises nearly 17% of
malignancies in children younger than 20
years of age. As a group, CNS cancer is the
most common solid tumor and the second
most common malignancy of childhood.
The overall annual incidence in the United
States is about 27 per million children
younger than 20 years of age (29 per mil-
lion with intracranial germ cell malignan-
cies included). The incidence of CNS cancer
is higher in children younger than 8 years
of age than in older children or adolescents.
This difference is largely attributable to
cerebellar PNET (medulloblastoma), brain
stem gliomas and ependymomas, which all
occur primarily before the age of 10 years.
CNS cancer incidence is slightly higher in
males than in females, largely due to the
male predominance of PNET and ependy-
momas. Rates are higher in white children
than in black children, although the differ-
ences are seen primarily in males and in
young children. Survival, which is depen-
dent on the type and location of the CNS
malignancy, tends to be worse in very
young children than in older children. CNS
cancer incidence rates remained essentially
stable from 1986-95. Unfortunately, the
causes of CNS cancer remain largely unde-
termined. The few definitive risk factors
that are known explain only a small propor-
tion of the total case population.
Reference List
1. Heideman RL, Packer RJ, Albright LA, Free-
man CR, Rorke LB; Tumors of the central
nervous system. Pizzo P, Poplack D, Editors.
Principles and Practices of Pediatric Oncology.
3rd ed. Philadelphia, PA: Lippincott-Raven;
1997:633-697.
2. Kleihues P, Burger PC, Scheithauer BW. The
ICCC III CNS
62
National Cancer Institute
SEER Pediatric Monograph
new WHO classification of brain tumours.
Brain Path. 1993;3:255-268.
3. Kramarova E, Stiller CA. The international
classification of childhood cancer. Int J Cancer
1996;68:759-765.
4. Gurney JG, Wall DA, Jukich PJ, Davis FG. The
contribution of nonmalignant tumors to CNS
tumor incidence rates among children in the
United States. Cancer Causes Control
1999;10:101-105.
5. Smith MA, Feidlin B, Ries LAG, Simon R.
Trends in reported incidence of primary
maligant brain tumors in children in the
United States. J Natl Cancer Inst
1998;90:1269-1277.
6. Gurney JG, Ross JA, Wall DA, Bleyer WA,
Severson RK, Robison LL. Infant cancer in the
U.S.: histology-specific incidence and trends,
1973 to 1992. J Pediat Hematol Oncol
1997;19:428-432.
7. Gurney JG, Davis S, Severson RK, Fang J-Y,
Ross JA, Robison LL. Trends in cancer inci-
dence among children in the U.S. Cancer
1996;78:532-541.
8. Bunin GR, Feuer EJ, Witman PA, Meadows AT.
Increasing incidence of childhood cancer:
report of 20 years experience from the greater
Delaware Valley Pediatric Tumor Registry.
Paediatr Perinat Epidemiol 1996;10:319-338.
9. EPA Conference on Preventable Causes of
Cancer in Children (Minutes). Office of
Children’s Health Protection, U.S. Environ-
mental Protection Agency. Washington, DC
20460, 1997.
10. Preston-Martin S and Mack WJ. Neoplasms of
the nervous system. In: Cancer Epidemiology
and Prevention. D Schottenfeld and JF
Fraumeni eds. Oxford University Press, New
York, 1996;1231-1281.
11. Ron E, Modan B, Boice JD, Alfandary E,
Stovall M, Chetrit A, and Katz L. Tumors of the
brain and nervous system after radiotherapy in
childhood. N Engl J Med 1988;319:1033-1039.
12. Shore RE, Albert RE, and Pasternack BR.
Follow up study of patients treated by X-ray
epilation for tinea capitis: Resurvey of
post-treatment illness and mortality experi-
ence. Arch Environ Health 1976; 31:21-28.
13. Kuijten RR and Bunin GR. Risk factors for
childhood brain tumor: A review. Cancer
Epidemiol Biomarkers Prev 1993;2:277-288.
14. Narod SA, Stiller C, Lenoir GM. An estimate
of the heritable fraction of childhood cancer. Br
J Cancer 1991; 63:993-9.
15. Bunin GR, Kuijten RR, Buckley JD, Rorke LB,
and Meadows AT. Relation between maternal
diet and subsequent primitive neuroectodermal
brain tumors in young children. N Engl J Med
1993; 329:536-541.
16. Bunin GR, Kuijten RR, Boesel CP, Buckley JD,
and Meadows AT. Maternal diet and risk of
astrocytic glioma in children: a report from the
Children’s Cancer Group. Cancer Causes
Control 1994;5:177-187.
17. Preston-Martin S, Pogoda JM, Mueller BA,
Holly EA, Lijinsky W, and Davis RL. Maternal
consumption of cured meats and vitamins in
relation to pediatric brain tumors. Cancer
Epidemiol Biomarkers Prev 1996;5:599-605.
18. Kuijten RR, Strom SS, Rorke LB, Boesel CP,
Buckley JD, Meadows AT, and Bunin GR.
Family history of cancer and seizures in young
children with brain tumors: A report from the
Children’s Cancer Group (United States and
Canada) Cancer Causes and Control
1993;4:455-464.
19. Gurney JG, Mueller BA, Davis S, and Schwartz
SM. Childhood brain tumor occurrence in
relation to residential power line configura-
tions, electric heating sources, and electric
appliance use. Am J Epidemiol 1996;143:120-
128.
20. Davis JR, Brownson RC, Garcia R, Bentz BJ,
and Turner A. Family pesticide use and
childhood brain cancer. Arch Environ Contam
Toxicol 1993;24:87-92.
21. Bunin GR, Buckley JD, Boesel CP, Rorke LB,
and Meadows AT. Risk factors for astrocytic
glioma and primitive neuroectodermal tumor
of brain in young children: A report from the
Children’s Cancer Group. Cancer Epidemiol
Biomarkers Prev 1994;3:197-204.
22. Draper GJ, Heaf MM, and Kinnier Wilson LM.
Occurrence of childhood cancers among sibs
and estimation of familial risks. J Med Genet
1977;14:81-90.
23. Miller RW. Deaths from childhood cancer in
sibs. N Engl J Med 1968;279:122-126.
24. Farwell J and Flannery JT. Cancer in relatives
of children with central-nervous-system
neoplasms. N Engl J Med 1984;311:749-753.
25. McKean Cowdin R, Preston-Martin S, Pogoda
JM, Holly EA, Mueller BA, Davis RL. Parental
occupation and childhood brain tumors –
astroglial and primitive neuroectodermal
tumors. J Occup Environ Med 1998;40:332-
340.
26. Gurney JG, Preston-Martin S, McDaniel AM,
Mueller BA, Holly EA. Head injury as a risk
factor for brain tumors in children: results
from a multicenter case-control study. Epide-
miology 1996;7:485-9.
27. Gurney JG, Mueller BA, Preston-Martin S,
McDaniel AM, Holly EA, Pogoda JM, Davis RL.
A study of pediatric brain tumors and their
association with epilepsy and anticonvulsant
use. Neuroepidemiology 1997;16:248-55.
28. McLendon RE, Tien RD. Genetic syndromes
associated with tumors and/or hamartomas. In
Bigner DD, McLendon RE, Bruner JM: Russell
ICCC IIICNS
63
National Cancer Institute SEER Pediatric Monograph
and Rubinstein’s Pathology of Tumors of the
Nervous System, 6
th
Edition. Arnold; London
GB, 1998: 371-417.
29. Preston-Martin S, Gurney JG, Pogoda JM,
Holly EA, Mueller BA. Brain tumor risk in
children in relation to use of electric blankets
and water bed heaters. Am J Epidemiol
1996;143:1116-1122.
30. Preston-Martin S, Navidi W, Thomas D, Lee P,
Bowman J, Pogoda J. Los Angeles study of
residential magnetic fields and childhood brain
tumors. Am J Epidemiol 1996;143:105-119.
31. Pogoda JM, Preston-Martin S. Household
pesticides and risk of pediatric brain tumors.
Environ Health Perspect 1997; 105:1214-1220.
64
National Cancer Institute
SEER Pediatric Monograph