Reporting heterogeneity in self-assessed health among elderly Europeans pptx
Bạn đang xem bản rút gọn của tài liệu. Xem và tải ngay bản đầy đủ của tài liệu tại đây (334.21 KB, 14 trang )
RES E AR C H Open Access
Reporting heterogeneity in self-assessed health
among elderly Europeans
Christian Pfarr
1*
, Andreas Schmid
1
and Udo Schneider
1,2
Abstract
Introduction: Self-assessed health (SAH) is a frequently used measure of individuals’ health status. It is also prone
to reporting heterogeneity. To control for reporting heterogeneity objective measures of true health need to be
included in an analysis. The topic becomes even more complex for cross-country comparisons, as many key variables
tend to vary strongly across countries, influenced by cultural and instituti onal differences. This study aims at
exploring the key drivers for reporting heterogeneity in SAH in an international context. To this end, country specific
effects are accounted for and the objective health measure is concretized, distinguishing effects of mental and
physical health conditions.
Methods: We use panel data from the SHARE-project which provides a rich dataset on the elderly European
population. To obtain distinct indicators for physical and mental health conditions two indices are constructed.
Finally, to identify potential reporting heterogeneity in SAH a generalized ordered probit model is estimated.
Results: We find evidence that in addition to health behaviour, health care utilization, mental and physical health
condition as well as country characteristics affect reporting behaviour. We conclude that observed and unobserved
heterogeneity play an important role when analysing SAH and have to be taken into account.
Keywords: Reporting heterogeneity, SHARE, Generalized ordered probit
Background
Knowledge about the health status of individuals is para-
mount when health interventions are to be evaluated.
Often, self-assessed health (SAH) is used as a key mea-
sure to this end. However, SAH is prone to inaccuracies
due to reporting heterogeneity. Given an identical under-
standing of health-related questions and response style,
self-assessed health would reflect (unobservable) true
health which would make it a valid indicator. How-
ever, varying reporting behaviour leads to discrepancies
between self-assessed health and the underlying true
health. This may result in systematic differences in the
stated health across population subgroups, even if the
underlying true health status is identical. This gains
importance when cross country comparisons are con-
sidered. The respective institutional or cultural setting
can influence asymmetries between true and self-assessed
health. Objective health measures as well as SAH show
considerable differences between countries [1]. However,
they do not reveal any sort of common pattern, which
again directs the attention to potential causes for this
finding.
This study investigates a wide range of potential causes
for reporting heterogeneity in SAH. In detail, we focus
on individual level socio-economic factors as well as on
country level characteristics while controlling for object-
ive measures of true health.
There are two aspects that are of special interest for
the remainder of this article. The first relates to the rele-
vance of reporting heterogeneity in SAH. The second
elaborates on methodological issues that have to be con-
sidered when the extent and potential causes of this
effect are to be captured econometrically.
In the literature, labour supply and retirement are typ-
ical fields in which the relevance of reporting hetero-
geneity is investigated. The main focus of these papers is
on a possible endogeneity of health that may be driv en
by different valuations of individual health [2-4]. As it
becomes clear from these studies, SAH is an invalid
indicator, if current health and an objective measure are
* Correspondence:
1
Department of Law and Economics, University Bayreuth, Chair of Public
Finance, D-95440, Bayreuth, Germany
Full list of author information is available at the end of the article
© 2012 Pfarr et al.; licensee Springer. This is an Open Access article distributed under the terms of the Creative Commons
Attribution License ( which permits unrestricted use, distribution, and reproduction
in any medium, provided the original work is properly cited.
Pfarr et al. Health Economics Review 2012, 2:21
/>imperfectly correlated. Therefore, various studies try to
obtain an objective measure of individual’s health stock
[5]. Kerkhofs and Lindeboom [6] assume that endogene-
ity of health is driven by systematic misreporting in sub-
jective health questions. Their results suggest that
subjective health measures lead to biased estimates. In
an extension of this work, Lindeboom and Kerkhofs [7]
present evidence that the reporting of health problems is
characterized by a great deal of heterogeneity and suggest
to include more specific and therefore more objective
health indicators. In a recent study, Ziebarth [8] provides
evidence that compared to self-assessed health measures,
concentration and thus heterogeneity in reporting health
is significantly lower if other proxies of objective health,
e.g. the SF12 or grip strength are used. Finally, Etile and
Milcent [9] differentiate between the “production effect”
of true health status and the effect of reporting hetero-
geneity. They show that the latter one is driven by indivi-
duals’ income.
With their study van Doorslaer and Jones [10] shift the
focus towards methodological issues in the e conometrics
of reporting heterogeneity. They apply different estima-
tion models to scale the responses of self-assessed health
questions. Thereby the authors find that various sub-
groups of the population systematically use different
thresholds in classifying their health into a categorical
measure. If population sub-groups use different reference
points when answering health related questions this kind
of heterogeneity may express itself either in a shift of the
mean or in influencing the shape of the distribution [11].
The first effect is denote d as index shift and the distribu-
tion of the health measure shifts completely to the right
or left, whereas the shape itself remains unchanged. The
second effect is a cut-point shift, where reference points
depend on the individual response behaviour and charac-
teristics, which leads to a change in the shape of the dis -
tribution and thus to a non-parallel shift of cut-points.
Several studies investigate the presence of such a cut-
point or an index shift in the reporting of SAH.
The results are quite mixed. While Lindeboom and van
Doorslaer [11] find evidence for both kinds of shift de-
pending on age and gender but not on income, education
or language skills, Hernández-Quevedo et al. [12] only
present evidence for the presence of an index shift. Bago
d’Uva et al. [13,14] use anchoring vignettes to objectify
health measures.
a
Their results suggest that homoge-
neous reporting as well as a parallel shift of the reporting
thresholds can be ruled out for all countries in the sam-
ple. Furthermore they conclude that when self-assessed
health is used in the analysis of the distribu tion of doctor
visits a bias seems to exist.
Our study investigates a wide range of potential causes
for reporting heterogeneity in SAH while accounting for
both cut-point and index shifts. In detail, we focus on
individual level socio-economic factors as well as on
country level characteristics while controlling for object-
ive measures of true health.
Very similar to the aim of this study is the work by
Schneider et al. [15]. They analyse how both socio-
economic factors and disease experiences influence the
individual valuation of health. Applying a generalized
ordered probit model to German panel data, they control
for observed heterogeneity in the categorical health vari-
able allowing the thresholds to depend on ex-ante iden-
tified explanatory variables. The results suggest strong
evidence for cut-point shifts, especially regarding the ex-
perience with different kinds of illnesses. They also point
to a gender specific perception and assessment of health.
One major finding of the presented studies is that self-
reporting of health is affected by reporting heterogeneity.
More specifically, the studies show differences between
self-reported and the latent true health. The aim of this
study is to have a closer look at the potential causes for
these differences. To be able to investigate these differ-
ences a widely-used approach is the inclusion of more
objective health measures as proxies for true health as
proposed in the literature. Such objective measures can
be based on illnesses diagnosed by a physician or other
factors that are less susceptible to individual perceptions.
Whereas Schneider et al. rely on a single index with a
limited number of illnesses to capture true health we
use separate and more comprehensive proxies for true
mental and physical health, thereby covering multi-
dimensional aspects of health and improving the quality
of our objective health measure.
Furthermore, up to now all existing studies concerning
cut-point and index shifts are based on data for single
countries. Thus they are not able to control for the
effects of cultural and institutional differences and
whether heterogeneous reporting behaviour follows a
common pattern.
Summarizing, our paper contributes to the existing
literature that investigates the causes for reporting het-
erogeneity and cut-point as well as index shifts primarily
in two ways; first, we provide improved objective health
measures for physical and mental health. Second, by
using the international SHARE panel data we have a
closer look at country specific effects on reporting het-
erogeneity and include indicators such as out of pock et
health expenditures. Furthermore, contrary to all but one
study [15] we account for unobserved heterogeneity
through panel data meth ods.
In the remainder of this paper, section two describes
data and methods and gives first descriptive results on
country differences. The results of estimating the driv-
ing factors of heterogeneity are presented and discussed
in section 3 and the findings are summarized in a
conclusion.
Pfarr et al. Health Economics Review 2012, 2:21 Page 2 of 14
/>Method
Data description
In this study, we use data from the Survey of Health,
Ageing and Retirement in Europe (SHARE)
b
. The full
dataset contains information on more than 45,000 elderly
Europeans (aged 50 years or older as well as spouses and
partners irrespectively of their age) which was collected
in two survey periods (2004/05 and 2006/07). A broad
set of socioeconomics variables as well as in depth sur-
veys of special topics make SHARE a valuable tool for
research. In our case, health related questions are of par-
ticular interest. The survey embraces hard and soft health
variables as well as psychological variables, information
on health care utilisation and similar related topics.
To mitigate the effects of item non-response we use the
imputed version
c
of this dataset [16].
For the analysis of reporting heterogeneity, we use the
five-point categorical variab le self-assessed health . This
variable ranges from excellent (1) to poor (5). Using an
unbalanced panel structure, we include socio-demographic
characteristics, health related variables as well as country
indicator variables as explanatory factors. The complete list
of variables is presented in Table 1. The first group covers
age and gender effects, the influence of education and
income as well as family status and nationality. Possible
nonlinearity in calendar age is captured by including a lin-
ear as well as a quadratic age term. To incorporate pos-
sible impacts of income, we refer to the relative income
position of a household member based on the net house-
hold equivalent income [17]. The relative position depends
on the median separately computed for each country and
period. To compare education across countries, the Inter-
national Standard Classification of Education (ISCED
1997) is used. The group of health-related variables con-
sists of health behaviour, health condition and health care
utilization. The variables for physical and mental condi-
tions indicate multimorbidity and mental state of the
respondent. Both are indices ranging from 0 to 100, with
higher values indicating a worse condition (see chapter 2.2).
Moreover, doctor visits and the number of nights in hos-
pital are proxies for the utilization of health care. The
reference categories represent no doctor visits or no night
in hospital respectively. To account for cross-country vari-
ation not captured by the other variables, we include
country fixed effects with France as reference. The other
countries are Austria, Germany, Sweden, Netherlands,
Spain, Italy, Denmark, Greece, Switzerland and Belgium.
To control for differences in the health care systems, we
incorporate the out-of-pocket health expenditures as well
as the public health expenditures as percentage of total
health expenditures in our regression. Finally, to avoid
problems of endogeneity when considering the effects
of retirement on SAH, we use the effective retirement
age in each country as a macroeconomic indicator.
d
The total number of observations from the two periods
and eleven countries amounts to 53,931. As can be seen
from Table 2, the mean of self-assessed health is 2.95,
indicating a slight tendency to report a poor health sta-
tus. Almost 50 % of the respondents state to have been a
daily smoker for at least one year at some point in their
life. Only 33 % report frequent drinking of alcoholic bev-
erages during the past six months. Concerning health
care utilization, 86 % visited a doctor at least once in the
last twelve months, and 13 % had to stay in hospital for
at least one night.
Computation of physical and mental condition indices
The identification of cut-point and index shift is only
possible with an objective measure of true health. There-
fore, we use a wide range of physical disabilities and
mental states included in both waves of the SHARE data-
set. Concerning the physical disabilities, we rely on ques-
tions regarding specific illnesses which were diagnosed
by a physician. Our assessment of the individual’s mental
condition is closely linked to emotional health or well-
being which is captured through self-reported feelings
and valuations of the personal life situation . The included
aspects constitute core criteria for the EURO-D scale, a
depression symptom scale, and the F32 code (depressive
episode) of the ICD-10. For a detailed list of variables in
use see Table 3 and Table 4.
e
The procedure applied is based on the work of
Kerkhofs and Lindeboom [6] and Jürges [1]. We expand
their approach by constructing two separate indices –
one for physical and one for mental conditions – to
objectify the reporting of illnesses or emotional distress.
In a first step, we regress the binary indicator “limited
activities” separately on the sets of physical and mental
variables.
f
The regressions for the physical and mental
conditions index are run separately by country, gender
and survey period, using standard probit models. By
doing so, we account for different prevalence rates of
specific physical and mental conditions, gender differences
and time effects. The results of the index regression for
the period 2006/2007 are presented in Table 3 and
Table 4.
The results are reported separately for males and
females and for all countries. As one can see, there is
large variation between the countries. For both indices,
we find gender differences regarding the magnitude, the
sign and the significance of the coefficients. For males,
the magnitude of the heart attack coefficient in the phys-
ical index regression ranges from 0.84 in Italy to 0.30 in
the Netherlands. The highest impact for stroke is found
in Spain (1.18), while for France we find no significance
at all. Some forms of disea ses only show an impact in a
few countries, e.g. hip fracture, stomach ulcer or cancer.
For women, osteoporosis reveals changing signs. While
Pfarr et al. Health Economics Review 2012, 2:21 Page 3 of 14
/>the influence is highly significant and positive (0.74) for
German women, it is negative for Greece (-0.15). Con-
sidering the mental condition index, a similar pattern
is found for men and the attitude “feels guilty”. While
Austrians are affected negatively the picture is reverse
for Spain. Further items like difficulties to concentrate
on entertainment, no enjoyment and tearfulness are only
partly significant.
In a second step, the coefficients of the respective sub-
regressions are used to predict a “latent” variable of the
true health status for each individual. The predicted
values are transformed by using an inverse log transform-
ation resulting in positive values. We compute the final
indices by combining the results of the country sub-
regressions, i.e. we standardize the results across coun-
tries, but separately for gender and year. The final physical
and mental indices range from 0 to 100 with mean 50
and a standard deviation of 10 if all countries are consid-
ered. Country-specific means can deviate from this value.
A higher index value indicates a higher degree of multi-
morbidity or poor mental state respectively.
Cross-country comparison
For the further analysis of reporting heterogeneity across
European countries, it is important to take a closer look
at the distribution of self-assessed health. To make a
cross-country comparison meaningful, we compute age-
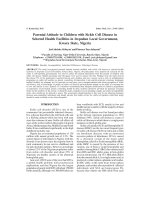
gender-standardized distributions of SAH. Figure 1 shows
the standardized distribution of SAH across countries
pooled for both observation periods.
Following the presented picture, the healthiest indi-
viduals live in Denmark and Sweden. This is in line
Table 1 Variable description
variable name variable description
SAH Self-assessed health, 1 = excellent, 5 = poor
Survey Period 1 if survey period 2006/2007
Gender 1 if female
Age Age in years
Age
2
Age squared divided by 100
Marital status 1 if living with a partner or a spouse
Foreign 1 if foreign
Grandchildren 1 if respondent has got one or more grandchildren
Children 1 if respondent has got one or more children
Very low income 1 if income ≤ 50 % of the country’s median equivalent net household income
Low income 1 if income > 50 % but ≤ 75 % of the country’s median equivalent net household income
High income 1 if income > 125 % but ≤ 150 % of the country’s median equivalent net household income
Very high income 1 if income > 150 % of the country’s median equivalent net household income
Education1 1 if the level of education according to the ISCED scale is 3 or 4 (reference is ISCED category 1 and 2)
Education2 1 if the level of education according to the ISCED scale is 5 or 6 (reference is ISCED category 1 and 2)
Smoking 1 if respondent has ever been a daily smoker for at least one year
Drinking 1 if respondent has been drinking alcoholic beverages at least once or twice a week over the past six months
Physical activity 1 if respondent is engaged in vigorous physical activity like sports or heavy housework at least once a week
Physical condition Index of respondents physical health status
Mental condition Index of respondents mental health status
Doctor visits 1-3 1 if 1 to 3 doctor visits in the last 12 months
Doctor visits 4-11 1 if 4 to 11 doctor visits in the last 12 months
Doctor visits >11 1 if more than 11 doctor visits in the last 12 months
Hospital nights 1-6 1 if 1-6 nights in hospital in the last 12 months
Hospital nights 7-14 1 if 7-14 nights in hospital in the last 12 months
Hospital nights >14 1 if more than 14 nights in hospital in the last 12 months
Out-of-Pocket Exp. Out-of-Pocket health expenditures as percentage of total expenditures on health
Public Health Exp. Public health expenditures as percentage of total expenditures on health
Effective Retirement Age Average effective age of retirement
Pfarr et al. Health Economics Review 2012, 2:21 Page 4 of 14
/>with the results presented in Jürges [1]. It is obvious that
there exists large variation across the countries. While
a fraction of 50 % of the Danish population reports very
good or better health, the proportion drops below 20 %
for Spain. On the contrary, only about 18 % of the Swiss
state their health as fair or poor whereas the least healthy
population seems to be in Italy and Spain (more than
40 % reporting a health status below good).
If reported differences are not only related to differ-
ences in true health, they are likely to depend also on
variations in the interpretation of the categories. There-
fore, we aim at identifying factors responsible for these
differences in the evaluation of self-assessed health across
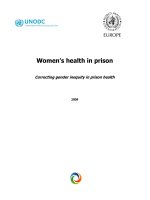
countries. While Figure 1 only shows the distribution of
self-assessed health categories across European countries,
Figure 2 represents the deviation from the age-gender
standardized mean of SAH.
Here, the differences between the countries are dis-
tinctly visible. The countries rating their health lower
than average are France, Germany, Italy and Spain. In the
period 2004/2005, Sweden shows the largest negative
deviation from the mean. This indicates that based on a
self-reported measure Sweden has the healthiest popula-
tion on average, even healthier than Denmark. The pic-
ture changes, however, when the period of 2006/2007
is considered. Here, the magnitude of the deviation for
Sweden has come down to a half, a fact not visible from
the pooled presentation in Figure 1. Between the obser-
vation periods, the devations are stable for Belgium, the
Netherlands and Austria.
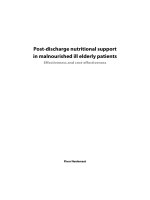
With respect to objective health measures, the country
deviations from the standardized mean of 50 for our
physical respectively mental condition indices are pre-
sented in Figure 3. Obviously, there exist large differ-
ences compared to the SAH figure. For the period 2004/
2005, in Sweden and Denmark, the countries with the
best self-assessed health, the picture for the objective
health indices is completely different. According to this,
reported health in those countries is overrated compared
to the underlying true health. A similar picture results
for Austria while for France and Italy the interpretation
is that reported health underrates true health. For the
period 2006/2007, the results change slightly. However,
some countries change from a negative to a positive de vi-
ation and vice versa. Moreover, according to Figure 3,
true health has significantly declined in Austria and the
Netherlands.
Finally, for most of the countries, we observe a higher
variation for the mental condition index. This may be
due to the fact that the physical index is based on
illnesses diagnosed by a physician, whereas the mental
index builds on self-reported criteria, which are less
strictly defined and as such much more prone to cultural
influences.
Table 2 Summary statistics
N = 53,931 Mean SD
Dependent variable
SAH 2.95 1.06
Explanatory variables
Survey Period 0.49 0.50
Gender 0.56 0.50
Age 64.45 10.35
Age
2
42.61 13.83
Marital status 0.76 0.43
Foreign 0.02 0.15
Grandchildren 0.63 0.48
Children 0.89 0.31
Very low income 0.15 0.35
Low income 0.18 0.38
High income 0.10 0.30
Very high income 0.28 0.45
Education1 0.31 0.46
Education2 0.19 0.39
Smoking 0.48 0.50
Drinking 0.33 0.47
Physical activity 0.50 0.50
Physical condition 49.87 9.91
Mental condition 49.93 9.95
Doctor visits 1-3 0.33 0.47
Doctor visits 4-11 0.36 0.48
Doctor visits >11 0.17 0.38
Hospital nights 1-6 0.07 0.25
Hospital nights 7-14 0.03 0.18
Hospital nights >14 0.03 0.16
Austria 0.06 0.23
Germany 0.10 0.30
Sweden 0.10 0.30
Netherlands 0.10 0.30
Spain 0.08 0.27
Italy 0.10 0.30
Denmark 0.08 0.27
Greece 0.11 0.31
Switzerland 0.04 0.20
Belgium 0.13 0.33
Out-of-Pocket Exp. 17.86 9.05
Public Health Exp. 71.98 6.76
Effective Retirement Age 60.89 1.96
Pfarr et al. Health Economics Review 2012, 2:21 Page 5 of 14
/>Table 3 Physical condition index
AUT GER SWE NED ESP ITA FRA DEN GRE SUI BEL
Male
heart attack 0.83 *** 0.59 *** 0.34 *** 0.30 ** 0.78 *** 0.84 *** 0.32 *** 0.44 *** 0.35 *** 0.46 ** 0.54 ***
high blood
pressure
−0.23 ** −0.22 *** −0.22 *** −0.31 *** −0.45 *** −0.45 *** −0.37 *** −0.37 *** −0.38 *** −0.53 *** −0.34 ***
high blood
cholesterol
−0.15 −0.18 * −0.31 *** −0.13 −0.33 *** −0.25 *** −0.54 *** −0.46 *** −0.44 *** −0.31 ** −0.51 ***
stroke 0.95 ** 0.61 *** 0.60 *** 0.96 *** 1.18 *** 1.12 *** 0.22 0.73 *** 0.68 *** 0.69 ** 0.69 ***
diabetes 0.54 *** 0.08 −0.00 0.18 −0.14 0.11 0.07 0.19 −0.04 −0.28 0.27 **
chronic lung
disease
1.51 *** 0.51 *** 0.51 ** 0.77 *** 0.64 *** 0.58 *** 0.62 *** 0.51 *** 0.36 * 0.94 *** 0.61 ***
asthma 0.41 0.33 0.08 0.37 * −0.35 0.11 0.07 −0.10 −0.13 −0.06 0.31
arthritis 0.49 ** 0.78 *** 0.53 *** 0.94 *** 0.44 *** 0.10 0.32 *** 0.35 *** 0.16 −0.16 0.30 ***
osteoporosis 0.78 ** 0.40 0.18 0.97 *** 0.17 0.63 ** 0.01 1.28 ** 0.08 0.51 0.12
cancer 0.73 * 0.19 −0.16 −0.06 0.23 0.74 *** 0.40 ** 0.23 0.09 0.16 0.63 ***
stomach/
duodenal ulcer
0.83 ** 0.26 0.10 −0.05 0.09 −0.29 * 0.06 0.09 −0.09 0.44 −0.13
parkinson
+)
1.05 * 0.99 ** 1.00 * 1.27 **
cataracts −0.25 −0.02 0.03 −0.16 0.24 0.17 0.35 * 0.10 0.22 −0.01 −0.02
hip fracture 0.18 0.28 0.54 ** 1.08 * 0.61 −0.34 −0.08 0.19 0.43 0.25 0.59 *
other 0.31 ** 0.55 *** 0.12 0.48 *** 0.29 *** 0.24 ** 0.28 *** 0.06 0.22 * 0.12 0.42 ***
N 540 1170 1258 1204 985 1339 1242 1166 1380 632 1421
Female
heart attack 0.48 ** 0.31 ** 0.22 ** 0.34 ** 0.61 *** 0.80 *** 0.61 *** 0.67 *** 0.77 *** 0.33 0.93 ***
high blood
pressure
−0.13 −0.17 ** −0.21 *** −0.13 * −0.38 *** −0.17 *** −0.19 *** −0.38 *** −0.28 *** −0.29 *** − 0.41 ***
high blood
cholesterol
−0.02 −0.31 *** −0.31 *** −0.11 −0.28 *** −0.31 *** −0.30 *** −0.30 *** −0.28 *** −0.51 *** −0.37 ***
stroke 0.77 * 0.56 ** 0.47 ** 0.62 ** 0.59 * 1.21 *** 0.18 0.94 *** 0.90 *** 0.53 0.50 *
diabetes 0.78 *** 0.55 *** 0.10 0.18 0.29 ** 0.40 *** 0.12 0.07 −0.14 −0.10 0.16
chronic lung
disease
0.63 ** 0.39 ** 1.14 *** 0.66 *** 0.38 * 0.49 *** 0.38 ** 0.53 *** 0.45 ** 0.07 0.57 ***
asthma 0.69 ** 0.37 * 0.14 0.59 *** 0.11 −0.03 −0.13 0.04 0.09 0.02 0.13
arthritis 0.66 *** 0.72 *** 0.42 *** 0.81 *** 0.48 *** 0.21 *** 0.21 *** 0.28 *** 0.20 *** 0.10 0.53 ***
osteoporosis 0.22 * 0.74 *** 0.10 0.34 *** 0.22 * 0.26 *** −0.04 0.21 −0.15 ** 0.35 * 0.08
cancer 0.74 * 0.52 *** −0.03 0.31 * 0.76 ** 0.44 ** 0.19 −0.07 0.13 0.08 0.73 ***
stomach/
duodenal ulcer
0.78 ** 0.30 0.21 0.41 0.21 −0.09 0.63 *** 0.18 −0.01 0.23 0.04
parkinson
+)
0.99 0.82 * 0.69 0.93 ** 1.33 ** 0.54 1.35 ***
cataracts −0.10 −0.02 0.18 * 0.22 0.29 * 0.45 *** 0.29 ** 0.29 ** 0.30 ** −0.10 0.20
hip fracture 1.40 *** 0.75 0.19 −0.15 0.78 *** 0.30 0.60 ** 0.22 0.20 0.66 1.18 ***
other 0.52 *** 0.50 *** 0.36 *** 0.45 *** 0.25 *** 0.19 ** 0.09 0.01 −0.03 0.21 ** 0.21 **
N 785 1372 1470 1432 1212 1629 1660 1436 1822 806 1730
+)
Variable dropped for some countries due to collinearity.
Pfarr et al. Health Economics Review 2012, 2:21 Page 6 of 14
/>Estimation approach
One obstacle to the traditional ordered probit model
used to analyse categorical variables is the single index
or parallel lines assumption [18]. The coefficient vector
is assumed to be the same for all categories of the
dependent variable. In detail, this can be interpreted as a
shift in the cumulated distribution function through an
increase of an independent variable, i.e. the distribution
shifts to the right or left, but there is no shift in the slope.
By relaxing this assumption and allowing the indices
to differ across the outcomes one gets the generalized
ordered probit model [19].
g
In our case, let y be the ordered categorical outcome of
SAH, y 2 {1, 2, , J}. J denotes the number of distinct
categories. Underlying the observed variable y is the
latent health status of the respondent y
*
. While we use
Table 4 Mental condition index
Male AUT GER SWE NED ESP ITA FRA DEN GRE SUI BEL
sad or depressed
last month
0.06 0.18 * 0.03 0.25 ** 0.19 0.32 *** 0.10 0.13 0.34 *** 0.24 0.04
felt would rather
be dead
0.61 −0.06 0.54 ** 0.25 0.66 ** 0.37 ** 0.41 *** 0.73 ** 0.58 * 0.17 0.35 **
feels guilty 0.62 ** 0.04 −0.05 0.18 −0.39 ** −0.05 −0.08 0.08 −0.07 −0.07 −0.06
trouble sleeping 0.66 *** 0.45 *** 0.39 *** 0.37 *** 0.28 ** 0.31 *** 0.25 *** 0.21 ** 0.26 ** 0.32 ** 0.28 ***
less or same
interest in things
0.29 0.39 ** 0.49 *** 0.16 0.12 0.14 0.01 0.05 0.32 *** −0.08 0.25 *
irritability −0.01 0.15 0.01 −0.06 0.24 ** −0.00 −0.14 0.04 −0.09 −0.25 * 0.06
no appetite −0.50 −0.27 −0.61 *** −0.85 *** −0.32 ** −0.32 ** −0.46 *** −0.42 ** −0.28 −0.82 *** −0.48 ***
fatigue 0.78 *** 0.55 *** 0.58 *** 0.73 *** 0.31 *** 0.62 *** 0.70 *** 0.54 *** 0.30 *** 0.53 *** 0.94 ***
difficulties
concentrating
on
entertainment
0.09 −0.15 0.27 * 0.33 ** 0.19 0.12 0.25 * 0.28 −0.04 0.39 ** 0.03
on reading 0.59 ** 0.23 0.11 0.11 0.50 *** 0.35 *** 0.12 0.41 *** 0.32 ** 0.17 0.38 ***
no enjoyment −0.04 0.25 ** −0.07 0.21 0.12 0.13 0.18 0.28 ** 0.16 0.27 −0.06
tearfulness −0.07 0.17 −0.05 0.08 0.07 −0.13 −0.06 0.12 −0.29 * 0.22 0.07
N 542 1162 1223 1178 941 1326 1175 1152 1348 629 1413
Female
sad or depressed
last month
0.46 *** 0.17 ** 0.11 −0.03 0.16 * 0.23 *** 0.01 0.24 *** 0.27 *** 0.07 0.01
felt would rather
be dead
0.32 0.33 0.22 0.28 0.16 0.64 *** 0.23 ** 0.43 ** 0.14 0.27 0.39 ***
feels guilty −0.01 −0.06 −0.07 −0.07 −0.06 −0.09 −0.14 * −0.06 −0.15 −0.17 −0.08
trouble sleeping 0.48 *** 0.30 *** 0.26 *** 0.39 *** 0.49 *** 0.20 *** 0.28 *** 0.24 *** 0.33 *** 0.26 ** 0.25 ***
less or same
interest in things
0.23 −0.08 0.32 ** 0.01 0.21 * 0.10 0.08 0.45 *** −0.01 0.26 0.07
irritability −0.13 −0.13 −0.02 0.21 * −0.04 −0.24 *** −0.17 ** 0.02 −0.34 *** −0.11 −0.08
no appetite 0.12 −0.39 *** −0.36 ** −0.32 ** −0.30 ** −0.02 −0.35 *** −0.32 ** −0.44 *** −0.66 *** −0.17
fatigue 0.69 *** 0.72 *** 0.63 *** 0.74 *** 0.32 *** 0.67 *** 0.73 *** 0.43 *** 0.37 *** 0.54 *** 0.68 ***
difficulties
concentrating
on
entertainment
−0.06 0.01 −0.19 0.44 *** 0.27 ** 0.14 0.24 ** 0.13 0.39 *** −0.26 0.13
on reading 0.47 ** 0.46 *** 0.42 *** 0.04 0.16 0.33 *** 0.17 * 0.45 *** 0.30 *** 0.56 *** 0.32 ***
no enjoyment 0.17 0.09 0.12 −0.00 0.37 *** 0.10 0.18 0.29 * 0.16 0.62 *** 0.23 **
tearfulness −0.25 ** 0.19 ** 0.08 0.06 0.14 0.15 * 0.08 0.08 0.11 −0.14 0.07
N 785 1359 1416 1419 1153 1597 1578 1407 1771 799 1704
* p < 0.1, ** p < 0.05, *** p < 0.01.
Pfarr et al. Health Economics Review 2012, 2:21 Page 7 of 14
/>panel data, we apply a random effects generalized ordered
probit model. For the data at hand, i denotes the cross-
sectional unit and t the time dimension:
y
Ã
it
¼ x
0
it
β þ E
it
E
it
¼ u
it
þ α
i
y
it
¼ j ,
~
κ
jÀ1
þ x
0
it
γ
jÀ1
≤y
Ã
it
≤
~
κ
j
þ x
0
it
γ
j
; j ¼ 1; ; 5
E E
it
½¼0
Var E
it
½¼1 þ σ
2
α
Corr E
it
; E
is
½¼ρ ¼
σ
2
α
1 þ σ
2
α
ð1Þ
The βs are the unknown coefficients. While in the
traditional ordered probit model the unknown threshold
parameters are constant, the threshold parameters in the
generalized model к
ij
are individual spe cific and depend
on the covariates:
h
κ
ij
¼
~
κ
j
þ x
0
it
γ
j
; ð2Þ
Here, γ
j
are the influence parameters of the covariates
on the thresholds and
~
κ
j
represents a constant term. It is
important to note that the coefficients of the covariates
0%
20%
40%
60%
80%
100%
DEN SWE SUI NED BEL AUT GRE FRA ITA GER ESP
excellent very good good fair poor
Self−assessed health
Figure 1 Distribution of self-assessed health by country.
−.4 −.2 0 .2 .4 −.4 −.2 0 .2 .4
AUT
GER
SWE
NED
ESP
ITA
FRA
DEN
GRE
SUI
BEL
AUT
GER
SWE
NED
ESP
ITA
FRA
DEN
GRE
SUI
BEL
2004/2005 2006/2007
Deviation from the mean of SAH
Figure 2 Deviation from the mean of self-assessed health by country.
Pfarr et al. Health Economics Review 2012, 2:21 Page 8 of 14
/>and the threshold coefficients cannot be identified separ-
ately if the same set of variables x is used.
y
it
¼ j ,
~
κ
jÀ1
þ x
0
it
γ
jÀ1
≤y
Ã
it
¼ x
0
it
β þ E
it
≤
~
κ
j
þ x
0
it
γ
j
;
with j ¼ 1; ; 5; t ¼ 1; ; T ; i ¼ 1; ; N:
ð3Þ
From this, it is clear that β
j
= β – γ
j
. Following Williams
[20], this results in the estimation of J-1 binary probit
models (see section 4). For our purpose, this method
enables us to control for individual heterogeneity in the
β-parameters and hence for heterogeneity across the
categories of the dependent variable. Consequently,
the advantage of using panel data in combination with
a generalization of the ordered probit model is to
distinguish between two kinds of heterogeneity. First,
unobserved individual heterogeneity is captured by our
random effects specification. Second, varying cut-points
and beta coefficients characterize the observed hetero-
geneity in the reporting of self-assessed health.
Individual specific β coefficients imply a cut-point shift
if the relative position of these thresh olds changes.
If we find a parallel shift in the thresholds instead, the
distribution of SAH shifts completely to the left or the
right (index shift). The distinction between both kinds of
shifts is of high relevance if the parallel shift cannot be
separated from changes in the relative position of the
thresholds [11]. To identify cut-point and index shifts,
Lindeboom and van Doorslear [11] assume that true
health is conditioned by objective health measures. In our
generalized model, we first test for a cut-point shift related
to our mental and physical health index. If the hypothesis
of a cut-point shift is rejected, an index shift exists.
The iterative procedure to identify variables that drive
the heterogeneity was first proposed by Williams [20] for
cross-section data. In an extension, Pfarr et al. [21] com-
bine this with the random-effects specification of the
generalized ordered probit model by Boes [19].
i
Empirical evidence
Results
Table 5 presents the results of the estimation of a gener-
alized ordered probit model for panel data. In the table,
we display the results of the four underlying binary
models. The first model estimates category 1 (excellent)
versus categories 2, , 5, the second model categories 1
and 2 (excellent and very good) versus 3, , 5 and so on.
The interpretation of a negative coefficient for the
model 1-2 versus 3-5 is as follows: the negative value
indicates a higher probability to report categories 1 or 2,
while a positive coefficient indicates a higher probability
of reporting the worse health status.
According to our iterative procedure, we end up with
13 variables to be constrained in the estimation. This
means that these variables are assumed to have equal
effects across the categories of self-assessed health and
hence across the four binary models. In detail, the
parallel lines assumption holds for Gender, Marital
status, Children, Education1, all variables of relative
income, Drinking and the three variables covering hos-
pital night s. In addition, public health expenditures is
the only country specific indicator that meets the parallel
lines assumption. However, it is not significant.
Regarding the income effects, individuals from house-
holds with an income lower than 75 % of the median
−10 −5 0 5 −10 −5 0 5
AUT
GER
SWE
NED
ESP
ITA
FRA
DEN
GRE
SUI
BEL
AUT
GER
SWE
NED
ESP
ITA
FRA
DEN
GRE
SUI
BEL
2004/2005 2006/2007
Deviation from the mean of physical index Deviation from the mean of mental index
Figure 3 Deviation from the mean of mental and physical health index by country.
Pfarr et al. Health Economics Review 2012, 2:21 Page 9 of 14
/>Table 5 Estimation results of the generalized ordered probit model
SAH 1 vs. 2-5 1-2 vs. 3-5 1-3 vs. 4-5 1-4 vs. 5
Coeff. p value Coeff. p value Coeff. p value Coeff. p value
Survey Period 0.037 (0.155) 0.060 (0.003) 0.228 (0.000) 0.158 (0.000)
Gender 0.088 (0.000) 0.088 (0.000) 0.088 (0.000) 0.088 (0.000)
Age 0.079 (0.000) 0.084 (0.000) 0.061 (0.000) 0.016 (0.276)
Age
2
−0.047 (0.000) −0.048 (0.000) −0.035 (0.000) −0.006 (0.561)
Marital status 0.056 (0.001) 0.056 (0.001) 0.056 (0.001) 0.056 (0.001)
Foreign −0.027 (0.707) 0.145 (0.014) 0.190 (0.002) 0.321 (0.000)
Grandchildren 0.028 (0.279) 0.036 (0.080) 0.097 (0.000) −0.032 (0.331)
Children −0.017 (0.468) −0.017 (0.468) −0.017 (0.468) −0.017 (0.468)
Very low income 0.106 (0.000) 0.106 (0.000) 0.106 (0.000) 0.106 (0.000)
Low income 0.090 (0.000) 0.090 (0.000) 0.090 (0.000) 0.090 (0.000)
High income −0.053 (0.057) −0.053 (0.057) −0.053 (0.057) −0.053 (0.057)
Very high income −0.132 (0.000) −0.132 (0.000) −0.132 (0.000) −0.132 (0.000)
Education1 −0.230 (0.000) −0.230 (0.000) −0.230 (0.000) −0.230 (0.000)
Edcuation2 −0.411 (0.000) −0.508 (0.000) −0.492 (0.000) −0.321 (0.000)
Smoking 0.046 (0.040) 0.084 (0.000) 0.078 (0.000) 0.165 (0.000)
Drinking −0.116 (0.000) −0.116 (0.000) −0.116 (0.000) −0.116 (0.000)
Physical activity −0.308 (0.000) −0.356 (0.000) −0.447 (0.000) −0.548 (0.000)
Physical health index 0.016 (0.000) 0.023 (0.000) 0.034 (0.000) 0.032 (0.000)
Mental health index 0.033 (0.000) 0.042 (0.000) 0.051 (0.000) 0.052 (0.000)
Doctor visits 1-3 0.366 (0.000) 0.280 (0.000) 0.177 (0.000) −0.074 (0.222)
Doctor visits 4-11 0.831 (0.000) 0.778 (0.000) 0.719 (0.000) 0.384 (0.000)
Doctor visits >11 1.045 (0.000) 1.107 (0.000) 1.174 (0.000) 0.808 (0.000)
Hospital nights 1-6 0.188 (0.000) 0.188 (0.000) 0.188 (0.000) 0.188 (0.000)
Hospital nights 7-14 0.322 (0.000) 0.322 (0.000) 0.322 (0.000) 0.322 (0.000)
Hospital nights >14 0.581 (0.000) 0.581 (0.000) 0.581 (0.000) 0.581 (0.000)
Austria −0.437 (0.037) −0.832 (0.000) −1.913 (0.000) −1.511 (0.000)
Germany 0.064 (0.622) −0.281 (0.003) −1.069 (0.000) −1.002 (0.000)
Sweden −0.975 (0.000) −1.087 (0.000) −2.175 (0.000) −1.330 (0.000)
Netherlands −0.437 (0.000) −0.432 (0.000) −0.407 (0.000) −0.848 (0.000)
Spain 0.023 (0.945) −0.207 (0.403) −2.336 (0.000) −1.485 (0.001)
Italy −0.345 (0.271) −0.241 (0.307) −1.969 (0.000) −1.242 (0.002)
Denmark −0.850 (0.000) −1.213 (0.000) −1.616 (0.000) −1.085 (0.000)
Greece −0.199 (0.763) −0.581 (0.238) −4.329 (0.000) −2.378 (0.006)
Switzerland −0.786 (0.134) −0.962 (0.014) −4.289 (0.000) −2.576 (0.000)
Belgium −0.371 (0.160) −0.521 (0.009) −2.066 (0.000) −1.431 (0.000)
Out-of-Pocket Exp. 0.015 (0.493) 0.007 (0.667) 0.143 (0.000) 0.074 (0.010)
Public Health Exp. −0.002 (0.522) −0.002 (0.522) −0.002 (0.522) −0.002 (0.522)
Effective Retirement Age 0.020 (0.198) 0.029 (0.027) 0.063 (0.000) 0.070 (0.001)
_cons −4.957 (0.000) −7.326 (0.000) −12.254 (0.000) −11.791 (0.000)
ρ 0.417 (0.000)
N 53931
Note: For those variables printed in bold the parallel lines assumption holds.
Pfarr et al. Health Economics Review 2012, 2:21 Page 10 of 14
/>tend to report a poorer health status compared to the
reference category (income > 75 % but ≤ 125 % of the
country’s median equivalent net household income).
For households with a higher income (more than 125 %
of median), we find a significantly negative impact. The
interpretation is that ceteris paribus individuals from
households with high income tend to report a better
health status. Taking the income-health nexus into
account, this result is not surprising. The variable reflect-
ing moderate as well as frequent consumption of alco-
holic beverages indicates a tende ncy to report a better
health status.
Variables for which the parallel lines assumption is
not imposed drive the observed heterogeneity in self-
assessed health. The effects of these variabl es are allowed
to vary across the four binary regressions, meaning that
the coefficients may differ with respect to magnitude,
sign and level of significance. Within the group of socio-
economic variables Education2, Smoking and Physical
activity show varying influence on the distinct categories
of SAH. For the first variable – Education2 – the effect is
significantly negative across all equations. The magnitude
of the corresponding coefficients differs only slightly.
Higher education – in terms of a university degree or
vocational training – thus leads to a better self-reported
health status. The signs of the other two factors –
Smoking and Physical activity – are as expected. We find
positive coefficients for (current or past) smokers and
negative ones for physical activities. The magnitude for
both variables increases in absolute terms and is highest
for equation 1-4 vs. 5. Hence, poor health is reported
more often by smokers, but less often for individuals
doing sports or heavy housework. Related to the age
structure of the SHARE dataset, the effect of smoking
shows the long-lasting impact of adverse health behaviour.
Health care utilization of outpatient care shows large
and significant effects. While 1-3 doctor visits in the last
12 months are only significant for the first three equa-
tions , more than 4 visits are significant for all regressions.
Comparing 1-3 with 4-11 visits, the coefficients of the
latter factor are more than twice as high. In addition, the
effect is stronger for individuals visiting a doctor more
than once a month on average. Using a sample of elderly
Europeans, these effects are not surprising and corres-
pond to an increasing morbidity at higher age.
j
Both health indices are highly significant and positive
over all equations. It is obvious that the coefficients for
the mental condition index are always higher than the
ones for the physical condition index. Individuals suffer-
ing from mental disorders hence may report to be more
limited with respect to their health than individuals with
diagnosed physical diseases. Thus, in particular mental
effects drive the reporting heterogeneity. Concerning
cut-point and index shifts, both indices enable us to
incorporate proxies of true health. As both proxies are
varying across the categories, we are able to rule out the
possibility of a parallel shift in the thresholds (index
shift). Hence, comparing answers on self-assessed health
with illness related as well as mental health related ques-
tions gives evidence for the hypothesis that heterogeneity
is driven by objective health measures.
We also include 10 country dummy variables with
France as reference category. This enables us to control
for cultural characteristics as well as to take peculiarities
of the health care systems into account. Those countries
with the healthiest population (D enmark, Sweden and
Switzerland) show a distinct pattern, namely negative
and highly significant coefficients for all four equations
compared to France. Individuals in those countries are
more likely to report a better health status. The influence
is highest when deciding between health categories excel-
lent and very good on the one hand, versus good to poor
on the other hand. Taking into account Figure 1, this
resembles the fact that over 40 % of the people in these
countries state to be in the two best health categories.
Opposite to these findings, we obtain alternating signs of
the coefficients for some countries. For example, in rela-
tion to France, Germa ny tends to report excellent status
less often, while the remaining coefficients show a trend
towards reporting the middle category. This comes along
with the highest negative impact for the last equation,
meaning that Germans state poor health less likely than
the French. In relation to the reference country, Germans
neither report excellent nor poor health status very likely.
The findings for Greece are somewhat different, because
a positive coefficient for the first equation is followed by
a negative for the second, while the last two are positive
again. This would imply that Greeks prefer to state very
good instead of excellent health, but are less likely to
classify themselves into the middle category.
Regarding the two variables that cover differences in
health systems, only the out-of-pocket expenditures show
a varying and partly significant effect. The level of private
out-of-pocket health expenditur es is relevant when dif-
ferentiating between the middle category and very poor
health. This implies that the higher the out-of-pocket
expenditures the worse the individual reported health
status. In the contrary, public health expenditures do not
seem to be of relevance for the individual perception
of health.
Finally, also the effective retirement age effects self-
reported health. The higher the effective retirement age,
the higher is the likelihood to state a lower health status.
This is plausible, considering the evidence presented by
Coe and Zamarro [4]. They find that retired people have
a tendency to report a better health status. In our data,
the sample from a country with a higher effective retire-
ment age is likely to embrace a larger share of still
Pfarr et al. Health Economics Review 2012, 2:21 Page 11 of 14
/>working elderly individuals who tend to report a worse
health status.
k
The influence of unobserved heterogeneity
is confirmed by the high significance of the correlation
of the error terms ρ.
Discussion
The results presented above have to be critically assessed
considering potential limitations that are caused by the
chosen method and the underlying data. Regarding
the construction of the two objective health measures
the dependent variable “limited activities” has to be
briefly discussed. In its ideal form this dependent variable
should be robust to country specific response styles.
As Table 6 indicates there is some variation regarding the
prevalence of “limited activities” between countries and
across gender and over time. The question is whether
such a variation might be partly due to factors such as
country specific response styles.
Summarizing Table 6, there is no clear picture regard-
ing country specific response styles. Following this and
considering the variables at hand we are confident that
this is the best measure available to serve as a proxy for
health status. The lack of a perfect dependent variable is
common to all related studies.
In line with Jürges [1], we assume that self-reported
diagnoses reflect true health status. Under this assump-
tion, the resulting health indices are robust to differences
in diagnosing illnesses across countries as they are con-
structed seperately for each country.
There may be concerns that the self-reported symp-
toms which form the basis for the mental health index
might be less reliable than diagnosed diseases. However,
the symptoms used to construct the mental condition
index are core elements of psycological classification sys-
tems such as the EURO-D or also the F32 code of the
ICD-10, the international statistical classification of dis-
eases and realted health problems. This strongly sup-
ports our assumption that the self-reported diagnoses
and the self-reported symptoms respectively are reliable
measures of true health.
As a last issue concerning the health indices time
effects have to be taken into account. That is, patients
may get used to certain conditions and at the same time
change their attitude towards a certa in health status.
Unfortunately, the dataset does not capture any informa-
tion on the time elapsed since the condition has been
diagnosed for the first time. The same applies to the
mental symptoms. We tried to capture at least the infor-
mation available from the two period panel data by con-
structing separat indices for each survey year.
With respect to the estimation endogeneity problems
regarding individuals’ health care use and health behav-
iour might exist. Therefore, we estimated three alterna-
tive specifications of the presented model controlling for
these issues. Specification I included neither variables on
health care utilization nor variables on health behaviour.
Specification II and III excludes either health care
utilization or health behaviour respectively. The results
show no systematic differences between the coefficients
of the physical and mental condition indices, of the
income variables, of age and of country fixed effects as
well as of country specific macro indicators.
l
The findings
support the assumption that potential endogeneity does
not affect the presented results in the results section.
Regarding the international perspective of the study,
only few country le vel indicators are available for the full
set of countrie s and for both survey periods, they may
capture unobserved country effects, too. Furthermore,
a larger number of countries would help to reduce the
remaining uncertainty. To check the robustness of our
results, we also estimated a model without the macro
level indicators, including only country dummies. When
including the three macro level indicators only the coeffi-
cients for the country dummies become less significant
and varied in their magnitude. This is especially the case
for countries such as Spain and Greece, which exhibit
an exceptional high proportion of out-of-pocket expen-
ditures. This means that health systems specific variables
capture a considerable portion of the effect which is
otherwise summarized by the country dummies.
Conclusions
Evaluation of health interventions is often based on vari-
ables such as self-assessed health (SAH). However, SAH
is prone to inaccuracies due to reporting heterogeneity
which may result in differences of the stated health
across population subgroups, even if the underlying true
health status is identical. As the elderly typically face the
highest level of morbidity and have usually a long history
Table 6 Country means of “limited activities”
Country Period 1: Means Period 2: Means
Male Female Male Female
Austria 0.427 0.500 0.498 0.536
Germany 0.456 0.518 0.465 0.491
Sweden 0.408 0.465 0.402 0.446
Netherlands 0.393 0.495 0.452 0.501
Spain 0.423 0.497 0.379 0.459
Italy 0.345 0.439 0.375 0.462
France 0.366 0.400 0.358 0.385
Denmark 0.425 0.481 0.345 0.386
Greece 0.251 0.317 0.250 0.296
Switzerland 0.311 0.361 0.289 0.331
Belgium 0.355 0.406 0.379 0.421
Overall 0.379 0.443 0.377 0.424
Pfarr et al. Health Economics Review 2012, 2:21 Page 12 of 14
/>of dealing with their health issues, reporting heterogen-
eity is a very likely problem in this group. Moreover,
it seems of high interest to see how institutional and
cultural settings influence the divergence of true and
self-assessed health. To account for such differences we
conduct a comparison across eleven European countries
using the Survey of Health, Ageing and Retirement in
Europe (SHARE) for a panel analysis. We estimate a
generalized ordered probit model to identify potential
cut-point shifts in the health distribution. To account for
true health, we compute indices for mental and physical
conditions and include these together with measures
for health care utilization, socio-demographic variables
and country fixed effects to evalua te their relevance for
reporting heterogeneity. While observed heterogeneity is
reflected in the cut-point shifts, we are able to account
for unobserved heterogeneity by using a random effects
specification.
The results of the generalized ordered probit model
indicate that cut-point shifts are present in the reporting
of self-assessed health across countries. For example, in
Germany individuals systematically report a lower health
status, whereas Dutch respondents show a higher prob-
ability to opt for the best category. For both health indi-
ces, we find evidence of reporting heterogeneity. This
means that a worse objective health status not only leads
to a lower perception of own health but also that the
impact of the effect varies between the categories of SAH.
Moreover, the magnitude of mental health problems
exceeds the effect of the pure physical health index. We
find further evidence for reporting heterogeneity when
looking at aspects like health care utilization and health
relevant behaviour. Hence, our results support the view
that there exists a gap between true and reported health.
As country effects may still reflect differences in health
systems as well as unaccounted cultural variation the
next step will be to elaborate on these two aspects in
more detail. This would allow deriving policy implica-
tions focusing on differences in health care systems from
an international perspective.
Endnotes
a
Here, respondents are asked to rate hypothetical
descriptions of a fixed level of a latent construct [22,23].
b
This paper uses data from SHARELIFE release 1, as of
November 24th 2010 or SHARE release 2.5.0, as of May
24th 2011. The SHARE data collection has been primar-
ily funded by the European Commission through the 5th
framework programme (project QLK6-CT-2001- 00360
in the thematic programme Quality of Life), through the
6th framework programme (projects SHARE-I3, RII-CT-
2006-062193, COMPARE, CIT5-CT-2005-028857, and
SHARELIFE, CIT4-CT-2006-028812) and through the
7th framework programme (SHARE-PREP, 211909 and
SHARE-LEAP, 227822). Additional funding from the U.
S. National Institute on Aging (U01 AG09740-13S2, P01
AG005842, P01 AG08291, P30 AG12815, Y1-AG-4553-
01 and OGHA 04-064, IAG BSR06-11, R21 AG025169 )
as well as from various national sources is gratefully
acknowledged (see www.share-project.org for a full list of
funding institutions).
c
A missing value is imputed five times, resulting in five
complete datasets including all imputed and not-imputed
variables [24]. The procedure is based on the fully con-
ditional specification method (FCS) of van Buuren et al.
[25].
d
For each observation period the out-of-pocket as well
as the public health expenditures were taken from the
World Development Indicators Database (WDI). The
effective retirement age as weighted average for each year
is provided by Keese [26].
e
In contrast to Jürges [1], we refrain from usin g the
variables walking speed and grip strength. These vari-
ables show a large number of missin g values (about 10 %
for grip strength) or are not available for respondents
younger than 75. Jürges assumes that all individuals for
which walking speed is not measured to have a normal
walking speed. Further, the BMI is not included in our
specification because first, it may influence both, mental
and physical conditions. Second, the BMI can be seen as
the result of individual behaviour rather than a diagnosed
disease. Moreover, espe cially obesity is closely related to
diseases such as diabetes, cholesterol, arthritis or heart
problems and influences the utilization of health care
resources [27].
f
The wording of the corresponding question is: “For the
past six months at least, to what extent have you been lim-
ited because of a health problem in activities people usu-
ally do?” Possible answers: Severely limited, limited but
not severely, not limited. Our binary dependent variable is
set zero if no limitation is indicated and one otherwise.
Both mental and physical health issues do have an impact
on individuals’ activities. This is supported by the correl-
ation matrix between our dependent variable and the vari-
ous mental and physical conditions. For both types of
conditions the correlation with the dependent variable is
within a range of 0.06 and 0.29.
g
For a general discussion of aspects of heterogeneity
in ordered choices and a detailed description of the gener -
alized ordered probit model see Greene and Henscher [28].
h
The order condition in the generalized ordered probit
model requires that the predicted probabilities are in the
(0; 1) interval.
i
The related user-written Stata program regoprob2 is
available at the SSC archive.
j
In our sample, over 23 % of those aged above 65 years
have more than 11 visits while this applies to only 12 %
for those 65 or younger.
Pfarr et al. Health Economics Review 2012, 2:21 Page 13 of 14
/>k
As additional country fixed effect the GDP per capita
(ppp) was included. However, no matter which com-
bination of variables was jointly estimated, the model did
not converge.
l
The full estimation results of the three alternative spe-
cifications are available upon request.
Competing interests
The authors declare that they have no competing interests.
Acknowledgments
For helpful comments we would like to thank Peter Zweifel, the participants
of the iHEA World Congress 2011 in Toronto, of the German Health
Economic Association annual meeting 2011 in Bayreuth and of the 32nd
Nordic Health Economists’ Study Group (NHESG) meeting in Odense.
Authors’ contribution
CP, AS and US have worked collaboratively during all stages of the project.
All authors read and approved the final manuscript.
Author details
1
Department of Law and Economics, University Bayreuth, Chair of Public
Finance, D-95440, Bayreuth, Germany.
2
WINEG – Scientific Institute of TK for
Benefit and Efficiency in Health Care, D-22305, Hamburg, Germany.
Received: 3 May 2012 Accepted: 18 September 2012
Published: 5 October 2012
References
1. Jürges H: True Health vs Response Styles: Exploring Cross-Country
Differences in Self-Reported Health. Health Econ 2007, 16:163–178.
2. Butler JS, Burkhauser RV, Mitchell JM, Pincus TP: Measurement error in
self-reported health variables. Rev Econ Stat 1987, 69 4:644.
3. Bound J: Self-Reported versus Objective Measures of Health in
Retirement Models. J Hum Resour 1991, 26 1:106–138.
4. Coe NB, Zamarro G: Retirement Effects on Health in Europe. J Health Econ
2011, 30 1:77–86.
5. Disney R, Emmerson C, Wakefield M: Ill Health and Retirement in Britain:
A Panel Data-Based Analysis. J Health Econ 2006, 25 4:621–649.
6. Kerkhofs MLM: Subjective Health Measures and State Dependent
Reporting Errors. Health Econ 1995, 4:221–235.
7. Lindeboom M, Kerkhofs M: Health and Work of the Elderly: Subjective
Health Measures, Reporting Errors and Endogeneity in the Relationship
between Health and Work. J Appl Econ 2009, 24 6:1024–1046.
8. Ziebarth NR: Measurement of health, the sensitivity of the concentration
index, and reporting heterogeneity. Soc S ci Med 2010, 71 1:116–124.
9. Etile F, Milcent C: Income-Related Reporting Heterogeneity in
Self-Assessed Health: Evidence from France. Health Econ 2006,
15 9:965–981.
10. van Doorslaer E, Jones AM: Inequalities in Self-Reported Health: Validation
of a New Approach to Measurement. J Health Econ 2003, 22 1:61–87.
11. Lindeboom M, van Doorslaer E: Cut-Point Shift and Index Shift in
Self-Reported Health. J Health Econ 2004, 23 6:1083–1099.
12. Hernández-Quevedo C, Jones AM, Rice N: Reporting Bias and Heterogeneity
in Self-Assessed Health: Evidence from the British Household Panel Survey,
HEDG Working Paper 05/04. York: University of York; 2005.
13. Bago d'Uva T, van Doorslaer E, Lindeboom M, O'Donnell O: Does Reporting
Heterogeneity Bias the Measurement of Health Disparities? Health Econ
2008, 17 3:351–375.
14. Bago d'Uva T, Lindeboom M, O'Donnell O, van Doorslaer E: Education-
related Inequity in Health Care with Heterogeneous Reporting of Health.
J R Stat Soc Ser A Stat Soc 2011, 174 3:639–664.
15. Schneider U, Pfarr C, Schneider B, Ulrich V: I feel good! Gender differences
and reporting heterogeneity in self-assessed health. Eur J Health Econ
2012, 13 3:251–265.
16. Börsch-Supan A, Jürges H: The Survey of Health, Ageing, and Retirement in
Europe - Methodology. Mannheim: Mannheim Research Institute for the
Economics of Aging (MEA); 2005.
17. Bundesamt S: Wissenschaftszentrum Berlin für Sozialforschung: Datenreport
2008: Ein Sozialbericht für die Bundesrepublik Deutschland. Berlin:
Bundeszentrale für politische Bildung; 2008.
18. Long JS: Regression models for categorical and limited dependent variables.
Thousand Oaks: Sage; 1997.
19. Boes S: Three Essays on the Econometric Analysis of Discrete Dependent
Variables, PhD thesis. Zürich: University of Zürich; 2007.
20. Williams R: Generalized ordered logit/partial proportional odds models
for ordinal dependent variables. Stata J 2006, 61:58–82.
21. Pfarr C, Schmid A, Schneider U: Estimating ordered categorical variables
using panel data: a generalized ordered probit model with an autofit
procedure. J Econ Econometrics 2011, 54 1:7–23.
22. King G: Enhancing the Validity and Cross-Cultural Comparability of
Measurement in Survey Research. Am Pol Sci Rev 2004, 98 1:191–207.
23. Rice N, Robone S, Smith P: Analysis of the Validity of the Vignette
Approach to Correct for Heterogeneity in Reporting Health System
Responsiveness. Eur J Health Econ 2011, 12 2:141–162.
24. Christelis D: Imputations. In: Mannheim Research Institute for the
Economics of Aging, editor. Release Guide 2.3.1, Waves 1 & 2. Mannheim:
MEA; 2010: p. 27–32.
25. van Buuren S, Brand JPL, Groothuis-Oudshoorn CGM, Rubin DB: Fully
Conditional Specification in Multivariate Imputation. J Stat Comput Simul
2006, 76 12:1049–1064.
26. Kees M: Live longer, work longer
. Paris: OECD; 2006.
27. Andreyeva T: An International Comparison of Obesity in Older Adults: Effects
and Risk Factors, PhD thesis. Santa Monica: RAND Corporation; 2006.
28. Greene WH, Hensher DA: Modeling Ordered Choices: A Primer. Cambridge
and New York: Cambridge University Press; 2010.
doi:10.1186/2191-1991-2-21
Cite this article as: Pfarr et al.: Reporting heterogeneity in self-assessed
health among elderly Europeans. Health Economics Review 2012 2:21.
Submit your manuscript to a
journal and benefi t from:
7 Convenient online submission
7 Rigorous peer review
7 Immediate publication on acceptance
7 Open access: articles freely available online
7 High visibility within the fi eld
7 Retaining the copyright to your article
Submit your next manuscript at 7 springeropen.com
Pfarr et al. Health Economics Review 2012, 2:21 Page 14 of 14
/>