Oscilloscopes 2012 ppt
Bạn đang xem bản rút gọn của tài liệu. Xem và tải ngay bản đầy đủ của tài liệu tại đây (15.23 MB, 275 trang )
Oscilloscopes
This Page Intentionally Left Blank
Oscilloscopes
How to use them, how they work
Fifth Edition
Ian Hickman
BSc (Hons), CEng, MIEE, MIEEE
ELSEVIER
B~WORTI-I
AMSTERDAM 9 BOSTON ~ HEIDELBERG ~ LONDON ~ NEW YORK 9 OXFORD
PARIS ~ SAN DIEGO ~ SAN FRANCISCO ~ SINGAPORE ~ SYDNEY ~ TOKYO
Newnes is an imprint of Elsevier
Newnes
An imprint of Elsevier
Linacre House, Jordan Hill, Oxford OX2 8DP
30 Corporate Drive, Burlington, MA 01803
First published 1981
Reprinted 1984
Second edition 1986
Revised reprint 1987
Reprinted 1989
Third edition 1990
Reprinted 1992, 1994
Fourth edition 1995
Reprinted 1997, 1998, 1999
Fifth edition 2001
Reprinted 2004, 2005
Copyright 9 1986, 1990, 1991, 1995,2001. Elsevier Ltd. All rights reserved
No part of this publication may be reproduced in any material form (including
photocopying or storing in any medium by electronic means and whether
or not transiently or incidentally to some other use of this publication) without
the written permission of the copyright holder except in accordance with the
provisions of the Copyright, Designs and Patents Act 1988 or under the terms of
a licence issued by the Copyright Licensing Agency Ltd, 90 Tottenham Court Road,
London, England W 1T 4LP. Applications for the copyright holder's written
permission to reproduce any part of this publication should be addressed
to the publisher
Permissions may be sought directly from Elsevier's Science & Technology Rights
Department in Oxford, UK: phone: (+44) 1865 843830, fax: (+44) 1865 853333,
e-mail: You may also complete your request on-line via
the Elsevier homepage (), by selecting 'Customer Support'
and then 'Obtaining Permissions'
British Library Cataloguing in Publication Data
A catalogue record for this book is available from the British Library
Library of Congress Cataloguing in Publication Data
A catalogue record for this book is available from the Library of Congress
ISBN 0 7506 4757 4
For information on all Newnes publications
visit our website at www.newnespress.com
Composition by Genesis Typesetting, Laser Quay, Rochester, Kent
Printed and bound in Great Britain by Biddies Ltd, King's Lynn, Norfolk
Contents
Preface
vii
Preface to fifth edition
ix
1. Introduction 1
2. The basic oscilloscope 8
3. Advanced real-time oscilloscopes 18
4. Accessories 33
5. Using oscilloscopes 52
6. Sampling oscilloscopes 88
7. Digital storage oscilloscopes 115
8. Oscilloscopes for special purposes 149
9. How oscilloscopes work (1): the c.r.t. 176
10. How oscilloscopes work (2): circuitry 188
11. How oscilloscopes work (3): storage c.r.t.s
Appendix 1 Cathode ray tube phosphor data
Appendix 2 Oscilloscope manufacturers and agents
Index
213
250
253
257
This Page Intentionally Left Blank
Preface
Who is this book meant for? It is for anyone who is interested in
oscilloscopes, how to use them and how they work, and for
anyone who might be if he or she knew a little more about
them.
It is easy to say what the book is not: it is not a textbook of any
sort, and particularly not a textbook on how to design oscillo-
scopes. Nevertheless, besides describing a great variety of oscillo-
scopes, their particular advantages and how to use them, the
book explains briefly how these instruments work, on the basis
that the best drivers have at least some idea of what goes on
under the bonnet. This takes us into electron physics and circuit
theory- but not too far. Formulae and results are simply stated,
not derived or proved, and those with only the haziest knowledge
of mathematics will find nothing to alarm them in this book.
Consequently, readers in their earliest teens will be able to learn
a lot from it; Chapter 1 is written especially for anyone with no
prior knowledge of the subject. Sixth-formers and students on
ONC and HNC courses should all find the book useful. Even
many degree students will find it of considerable help (though
they may choose to skip Chapter 1!); electronic engineering
undergraduates have plenty of opportunity to learn about
oscilloscopes, but many graduates come into electronic engineer-
ing from a physics degree course, and will welcome a practical
introduction to oscilloscope techniques.
Technicians and technician engineers in the electronics field
will of course be used to oscilloscopes, but the following chapters
should enlarge their understanding and enable them to use the
facilities of an oscilloscope to the full. Finally, I hope that those
whose interest in electronics is as a hobby, including many
amateur radio hams and radio-controlled-model enthusiasts, will
find the book valuable, especially if they are considering buying
or even constructing their own oscilloscopes.
This Page Intentionally Left Blank
Preface to fifth edition
Keeping this book up to date is rather like painting Edinburgh's
famous bridge over the Firth of Forth - no sooner do they get to the
end than it's time to start all over again at the beginning. In the
same way, no sooner does a new edition of this book come out than
one or other of the oscilloscopes illustrated or featured will go out
of production, usually to be replaced by a later, improved model.
And as for Appendix 2, one can more or less guarantee that by the
time a new edition is in the offing, at least 50 per cent of the
manufacturers or their agents will have changed their address or
telephone number.
As ever, the performance and value for money offered by the
current models have advanced considerably since the appearance
of the last (fourth) edition. This is a continuing source of mild
surprise and quiet satisfaction for anyone who has been interested
in the oscilloscope scene for any length of time - which in my case
amounts to nigh on fifty years.
My first scope, home built for cheapness of course, was a home-
brew conversion of an ex-RAF Indicator Unit Type 182A, which
incorporated a VCR517C cathode ray tube. The unit was available
on the post-war military equipment surplus market for a few
pounds, a lot of money in those days - especially for a lad still at
school. Even so, it was considerably cheaper than units containing
the more popular VCR97 cathode ray tube, with its short-
persistence green phosphor. So, for reasons of financial stringency,
my first oscilloscope had a long persistence cathode ray tube with a
blue 'flash' and yellow 'afterglow'. In its original role as a radar
display, a glass filter tinted deep yellow in front of the screen
suppressed the flash, but I removed this, making the tube rather
less inappropriate for oscilloscope duty. Nevertheless, the afterglow
was always a nuisance except for single shot applications or during
extended observation of a stable triggered waveform- unfortu-
nately I never thought of putting a deep blue filter in front of the
screen. (A subsequent conversion to TV use was even less
x
Preface
to
fifth
edition
satisfactory. Apart from blurred lips.
the
newsreader was
not
too
bad but
a
football match was a disaster. The blue ball with its
long
curved yellow tail looked like a
comet,
and when thc camera
panned from onc end
of thc ground to the ot.her, confusion reigned
supreme.)
A scopc with a long-persist.erice
screen
is
still very
~i~cf~il
in
certain applications, where
it
can
form
;1
very much cheaper oplion
than a variable-persistence storage
oscilloscope
or a
DSO
(digital
storage oscilloscope)
of
similar bandwidth. Oscilloscopcs offcring
the
option
of
a cathode ray tube with
a
long-pcrsistcnce screen in
place
of
a standard one are by now unobtainable, but many long-
persistence scopes are still in regular use. Thus in the world of the
oscilloscope, the old and the new both continue to be useful, each
in its appropriate sphere.
Another example
of
this is the ‘second user market’, an area of
steadily growing importance. As Government Departments and
Agencies and large firms re-equip themselves with the latest and
best in oscilloscopes, large quantities of used but perfectly
serviceable equipment are released.
Most
of this finds its way
onto
he
second user market, where dealcI-s specializing
in
this trade
offer
it
for
resale.
The
riiore
reputable dealers will have
had
the
cquip~icnl ovcrha
ulc~l
and rccalibrated
to
good-as-new condition,
dnd
it
thcn represents cxccllcnt
vnluc
for
thc
srnallrr
company,
the
indcpendcnt
consullaill
and
wen thc
kccn
clcctronics cnthusias~.,
Iri
!his
way, an cxccllcnt oscilloscope,
sprct
i-iini
analyser
or other
instrumcnt (adtnillcdly
of
a
rnodcl
often
no
1ongc.t.
it1
production)
can be obtained
lor
somewhere
betwccii
a
tc.n~h and
a
fifth
of
the
price
of
its current new equivalun1.
The
major
manufacturers
continue
to
support
such instrumcnts
for
some eight
to
ten years
after
the model was
discontinued.
So
a bargain scope can be
repaired
and
maintained as necessary, giving many years of faithful
servicc., especially
if
returned
to
the
maker
for
a
complete overhaul
j
list
before
the period of support expires.
This
filth
edition
of
the
hook,
which was lirst published in
1981
and
has
never been
out
of
print since,
ha\
been extensively revised.
Chapter
11,
describing how storage cathode ray tubes work, has
been retained.
It
was added at the third edition when ’analogue’
storage
scopes (i.e. those
using
direct-view
storage
c.r.t.s)
were
Preface to fifth edition xi
available from a number of manufacturers. This is no longer the
case, so perhaps the logical move might seem to be the omission of
the chapter in its entirety. But it has been retained, for a number of
reasons. Firstly, the description of the operation of storage c.r.t.s
illustrates some interesting aspects of electron optics, a branch of
physics on which all c.r.t.s depend for their operation. Secondly,
with the march of time, sources of information on the modus
operandi of storage cathode ray tubes will become rarer and rarer.
Thirdly and more importantly, many analogue storage scopes are
still in use, and some guidance on their advantages, limitations and
quirks may not come amiss. And while oscilloscopes using a storage
cathode ray tube no longer seem to be available (except on the
second user market), one of the major oscilloscope manufacturers
still produces analogue storage oscilloscopes, using a 'scan
converter tube'. The principle of operation of these is also touched
on in Chapter 11. The chapter has therefore been retained, but
with the substantial pruning carried out at the previous (fourth)
edition, while still covering all the fundamentals of the subject.
The book now includes photographs of later models of some of
the instruments which were illustrated in the fourth edition, plus
details and photographs of instruments from various manu-
facturers whose product lines were not previously represented in
these pages, whilst illustrations of models no longer available have,
with but one or two exceptions, been removed.
The author gratefully acknowledges the many manufacturers
and their agents who have assisted by providing information on,
and pictures of, their products. From these, a selection of
photographs has been included illustrating real-time oscilloscopes,
both storage and non-storage, sampling and digital storage
oscilloscopes and their accessories. In each case, the caption at least
gives brief details of the performance of the instrument, whilst in
several cases it has been possible to give a more extensive account
of its performance in the text. My special thanks are due to
Tektronix UK Ltd for providing material upon which I have drawn
freely in Chapters 6 and 11 and elsewhere, and for other valued
assistance.
I.H.
October 2000
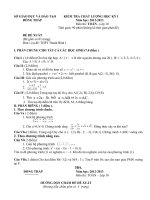
~ v
An
advanced
orcillowrpc
of
the
1940s.
Thc
Cossor
niodcl
1035
Mkl
1A
was
a true
dual
beam oscilloscope with
a
~~iaxirii~~iii bandwidth of
7
MHr
(Y
I
amplifier),
100
kHz
jY2
anqilifirrj
and
a
fasrcst
sweep rate
of
15
p
per scan,
with
repetitive,
triggered and single-stroke operation (courtesy
Coscor
Electronics
Lid)
1
Introduction
The cathode ray oscilloscope is an instrument designed to display
the voltage variations, periodic or otherwise, that are met with in
electronic circuits and elsewhere.
The word is an etymological hybrid. The first part derives
from the Latin, to swing backwards and forwards; this in turn
is from
oscillum,
a little mask of Bacchus hung from the trees,
especially in vineyards, and thus easily moved by the wind. The
second part comes from the Classical Greek
skopein,
to observe,
aim at, examine, from which developed the Latin ending-
scopium,
which has been used to form names for instruments
that enable the eye or ear to make observations. For some
reason the subject of the design and use of oscilloscopes is
generally not called oscilloscopy but oscillography, from oscillo-
and
graphein,
to write.
There are other types of oscilloscope besides those using
cathode ray tubes. For example, pen recorders, ultra-violet chart
recorders and XY plotters are all oscilloscopes or oscillographs of
a sort, as indeed is 'Fletcher's Trolley' of school physics fame.
However, this book is concerned mainly with cathode ray
oscilloscopes, together with the increasing number of similar
instruments using LCD (liquid crystal display) technology.
Representing a varying voltage
The basic principle of oscillography is the representation, by
graphical means, of a voltage that is varying. The voltage is
plotted or traced out in two-dimensional Cartesian coordinates,
named after Descartes, the famous French seventeenth-century
philosopher and mathematician.
Figure 1.1 shows the general scheme for the representation of
any two related variables. Both positive and negative values of
each variable can be represented. The vertical axis is called the Y
axis, and the horizontal the X axis. The point where the axes
cross, where both X = 0 and Y = 0, is called the 'origin'.
~ ~. temperot u re,~C
§
9 : :j
~ ~
9
~ , ,
~.o ,-,.
~. ~
k ,
~"
"-,~_
, ,. 0
~b
0
~~ 9 :1
~.~ , , ,
~
~'~ ~ ~ ~. ~
~< , , ~ _~. ~ ~
~,~ ~ ,
~ "~~ ~.~
,.m-4~
'-"
.
, ]
, ~ :::~-'
, ,
,_ ,. ,._,
~.
4,
9
~-,.
9
9
2
Oscilloscopes
-,
-3
-2
-1
-
0
1
2
3
X
-1
I
-2
Figure
1.1
may
he
two
different scales, even diilcrrnt units,
for
graphical purposes
Cartesian
or
graphical cnordinarcs.
The
horizontal and vertical axes
Any point is defined by its
X
and
Y
coordinates.
Thus
the
point
P
in the top right-hand quadrant
is
the point
(3,
2),
because
its
distance
to
the right (called
its
'abscissa'
or
X
coordinate)
is
3
units and its distance
up
(called
its
'ordinate' or
Y
coordinate) is
2
units.
Figtirt.
1.2
is
an
rxan~plt~
of
a
graph
ploltcd
on
Carlesian
coordinates and
shows
an
imaginary
plot
of
t.hc tcmprrat.urr
W
I
1Jan
I
(midnight)
midday
-5
Figure
1.2
Fictional
plot
of
teniperatiire in tirst
wcck
ot
January.
An
exarnple
of
a
graph
where the horironral and vertiral axcs
arc
to
different scales and
in
different units
Introduction 3
during the first week of January. Quantities that vary with time,
like temperature and voltage, are very important in engineering
and are frequently represented in graphical form. As we don't
usually attribute much meaning to the concept of negative time,
the Y axis (the vertical line corresponding to the point where X =
0, or the start of 1 January in this case) has been shown at the
extreme left. The X axis now represents time, shown in this case
in days, though for other purposes it might be minutes, seconds
or microseconds (usually written ~s and meaning millionths of a
second). Negative temperatures are plotted below the axis and
positive ones above it. Time is taken as increasing (getting later)
from left to right, starting at zero at the origin. Thus the X axis is
a 'timebase', above and below which the related variable (in this
case, temperature) is plotted.
Voltages can be positive or negative, just like temperatures. The
usual reference point for voltages is taken as earth or ground.
This is called zero volts, 0 V, just as 0~ the melting point of ice,
is taken as reference for temperatures.
What the oscilloscope shows
Where you or I might draw a graph like Figure 1.2 with a pencil,
an oscilloscope draws its 'trace' with a moving spot of light on the
screen of a cathode ray tube. The screen is approximately flat and
coated on the inside with a powder that emits light where it is
struck by a beam of electrons. More about the operation of the
cathode ray tube can be found in Chapter 9; here it is sufficient to
note that internal circuitry in the oscilloscope causes the spot of
light to travel from left to right across the 'screen' of the tube at
a steady rate, until on reaching the right-hand side it returns
rapidly to the left ready to start another traverse, usually called a
'trace', 'sweep' or 'scan'. As noted above, some oscilloscopes use
an LCD display. This is a trend which will continue; in future
more and more models, especially portable and handheld
oscilloscopes and digital storage oscilloscopes, will opt for this
display technology.
Figure 1.3 shows the picture that might appear on the screen of
an oscilloscope if it were used to display the waveform of the 240 V
a.c. (alternating current) domestic mains electricity supply. This
4 Oscilloscopes
Figure 1.3 240V a.c. mains waveform, displayed at 100 volts per division
vertically and 5 milliseconds per division horizontally
actually varies between plus and minus 340 V, with a rounded
waveform closely approximating a shape known as a sine wave - a
very important waveform in electrical engineering. As its positive
and negative loops are the same size and shape, the sine wave's
'mean' or average value is zero. The mains is described as 240 V a.c.
because that is its 'effective' value; that is to say, an electric fire
would give out the same heat if connected to 240V d.c. (direct
current) mains, as it does on 240 V a.c. mains.
The screen of an oscill~)scope is often equipped with vertical
and horizontal rulings called a 'graticule'. In Figure 1.3 the scan
or X deflection speed corresponds to 5 milliseconds per division
(5 ms/div). Likewise, in the vertical or Y direction, the sensitivity
or 'deflection factor' is 100 V per division. On oscilloscopes with a
13cm (Sinch) nominal screen diameter, the divisions are
centimetre squares. However, some oscilloscopes have a smaller
screen size than this. In such cases, graticules with fewer
centimetre square divisions are sometimes found, but more
usually smaller divisions are used, to enable the convenient 10 x
8 or 10 • 6 division format t() be retained.
'Trigger' circuitry in the oscilloscope ensures that the trace
shown always starts at the same point on the waveform. In our
example, the trace starts as the 240 V a.c. mains voltage is passing
through zero, going positive. The frequency of the mains is 50 Hz
Introduction 5
Figure 1.4 The OsziFOX handheld oscilloscope operates from a 9 V d.c. supply.
This plugs into the rear end, and may be the matching mains power supply unit,
or a PP3/6F22 miniature 'transistor' battery. With 20Ms/s 6bit signal capture,
displays can alternatively be downloaded to a PC via a D9 serial port (reproduced
by courtesy of Pico Technology Ltd)
Figure 1.5 The 200MHz PM3394B is the top model in the PM33xxB range of
Fluke 'Combiscopes'| These provide both real-time and digital storage modes.
The least expensive PM3370B, pictured above, features 60MHz bandwidth in
either mode, a 5.8 ~s risetime and a 200Ms/s single shot sample rate, 10Gs/s
effective for repetitive signals (reproduced by courtesy of Fluke Europe BV)
6 Oscilloscopes
(Hz is short for hertz and means 'cycles per second'); thus it takes
20ms to complete each cycle. As the full ten squares of the
graticule represent 50 ms in the horizontal direction, two and a
half complete cycles are traced out as the spot scans across the
screen. During the next half cycle the spot returns rapidly to the
left of the screen. This return journey is called the 'flyback' or
'retrace', but no trace of it is seen, as the spot is suppressed by a
'flyback blanking' circuit.
The next trace thus starts three cycles after the start of the
previous one, so 16~ identical traces are drawn every second.
This is not fast enough for the eye to see a single steady picture,
so there is pronounced flicker (unless the cathode ray tube uses
a long-persistence phosphor, see Appendix 1). If the scan or
Figure 1.6 Ttle DL708E, with built-in hardcopy printer, provides up to eight
isolated input channels with a maximum input of 850 V d.c. + a.c. peak. Input
modules are plug-in, with a choice of 10Ms/s 10 bit resolution, 100ks/s 16 bit
resolution, and various other options (reproduced by courtesy Yokogawa
Martron Ltd)
Introduction 7
Figure 1.7 The 8835-01 'MEMORY HiCORDER' from HIOKI provides four or
eight input channels and displays these on a 6.4 inch colour TFT display screen
and records them onto 110 mm thermal paper roll and into memory. Versatile
trigger functions include pre-trigger storage (reproduced by courtesy of ASM
Automation Sensors Limited)
sweep rate were changed from 5ms/div to 20ms/div, ten
complete cycles would appear per scan and the moving spot of
light would be seen bobbing up and down as it crossed the screen.
On the other hand, if a 500 Hz waveform were viewed at 0.5 ms/
div (the same as 500 ~s/div), there would be 166 identical traces
per second and a completely flicker-free picture would result.
However, this is only because the waveform itself is 'periodic', i.e.
it repeats exactly from cycle to cycle.
An example of a much more complex waveform that does not
repeat exactly is the output of a microphone recording a piece of
music. Here, we could never trigger an oscilloscope to give a
steady picture, as the waveform itself is constantly changing. The
basic oscilloscope, then, is primarily of use for viewing periodic
(repetitive) waveforms, although it is often necessary to view
single, non-repetitive waveforms: the more expensive oscillo-
scopes will take this job in their stride also.
Having learnt a little of what an oscilloscope is and what it can
do, in Chapter 2 we look in more detail at the facilities provided
by a basic oscilloscope.
2
The basic oscilloscope
Chapter 1 briefly described how an oscilloscope draws its trace
with a spot of light (produced by a deflectable beam of electrons)
moving across the screen of its c.r.t. (cathode ray tube). At its
most basic, therefore, a cathode ray oscilloscope (further details
of cathode ray tubes can be found in Chapter 9), consists of a
'timebase' circuit to move the spot steadily from left to right
across the screen at the appropriate time and speed, and some
means (usually a 'Y' deflection amplifier) of enabling the signal
we wish to examine to deflect the spot in the vertical or Y
direction. Alternatively some other display technology such as
LCD may be used, though in this case the instrument is usually a
digital storage type of oscilloscope.
In addition, of course, there are a few further humble essentials
like power supplies to run the c.r.t, or LCD display and circuitry,
a case to keep it all together, and a Y input socket plus a few
controls on the front panel. Figure 2.1 is a block diagram of such
an instrument.
This type of oscillosc()pe, more or less sophisticated as the case
may be, belongs to what was traditionally by far the commonest
and most important category: the 'real-time' oscilloscope. This
means simply that the vertical deflection of the spot on the screen
at any instant is determined by the Y input voltage at that instant.
Not all oscilloscopes are real-time instruments: Figure 2.2
attempts to categorise the various types available. The distinction
between real-time instruments and others is not absolute and
clear cut, but the fine distinctions need not worry us here.
A really basic oscilloscope then is one with the necessary
facilities for examining a repetitive waveform. An instrument
with but a single Y input, corresponding to Figure 2.1 and the
extreme left-hand branch of Figure 2.2, meets this description.
With such an instrument, the relative timing between the
waveforms at different points in a circuit can be established, albeit
indirectly, by using the external trigger input and viewing the
waveforms one after the other. The advantage of being able to see
The basic oscilloscope 9
c rt X c rt Y
frequency - deflect ~on deflect
~on
y compensated Y
plates
plates \
attenuator _amplifier
\. ~ ~._
,, ,lau, ~' C ~ I~ 9 I'~ ~ ~ ~ ~'~
~-~~
~ L_~ ~ _ ~-J
-~ " ',
.k~ /
, r
k -,/
y j
~ 7amp
Y detlect,on
I I I I I
~hi,t 3/ ,,oo~ I I I
] sweep x I I_ I
[ tr,gger~ngomp/
sweepgote
~imebas])
def.'ectionJ IDa!
trigger I ,nt l,,~slicer
.'og,\
~,,~,~- ~,og~ I I'~HI
,~e, / I I '1
T
I
t
Xir I to c.,-t.
S t gr,d 1
po,o~ity - ~,.~to,, . I ~,ooking
br
ght.n | amplifier
o- CirCUIT, A I
X sweep speed setting
input
mains on/
suppl ies
transformer
off
fuse
l,,,
Figure 2.1 Block diagram of basic oscilloscope. Note: It is now common to fit a
two pole main ON/OFF switch, both for safety reasons and to comply with
national electrical equipment regulations
relative timing directly by viewing two waveforms simultane-
ously is so great that, increasingly, even inexpensive basic
oscilloscopes offer this facility. Most of the instruments illustrated
throughout this book have two such independent channels, and
some have three or even four channels.
However, even a basic single channel oscilloscope is an
inestimable help in viewing the action of electronic circuits, and
the next section describes such an instrument, the Metrix OX71.
Although to some readers the facilities it provides may seem
entirely self-explanatory, they are in fact worth a closer look, and
a few comments on the characteristics and operation of scopes in
general have been thrown in for good measure.
I
real- time scopes
basic
scopes
sIng le- trace dual-trace,
scopes dual beam
scopes
1
advanced scopes
multiple
timeboses,
timebose delay
facilities.
signal delay etc
Figure 2.2 Types of cathode ray oscilloscope
cathode-roy osc, Iloscopes
! i
non-real-time scopes
scopes with storage sampling
long- scopes scopes
persistence
screens
'traditional'
storage
scopes
with
storage
c.r.t.
i
digital
storage
scopes
c.rt based instruments
not used solely for
di splaying woveforms.
e.g. logic analysers
I
I
I
I
c Ft based instruments
used for displaying things
Other than woveforms.
spectrum onolysers, time
clon,o mn r eflectometers,etc
The basic oscilloscope 11
Basic oscilloscope controls
The Metrix OX71, illustrated in Figure 2.3, is also known as the
'Didascope', from its intended didactic or educational role. Unlike
some low priced instruments, where the ON/OFF switch is
combined with the brilliance or intensity control, the OX71 is
provided with a separate push button mains switch, IN for ON,
OUT for OFF. There is also an LED mains indicator light, which
interestingly is red. This is or was the traditional colour for a
mains indicator light in the UK, but continental practice is to use
green for mains indicators, reserving red for an alarm or
malfunction indication.
Of course, a light is not usually needed as a warning that one
has left the oscilloscope switched on; after all, the trace on the
screen does that quite effectively. The indicator's main function is
to assure the user that, on plugging in and switching on, the
mains socket is live and hence the oscilloscope will be operational
as soon as the c.r.t, has warmed up.
An oscilloscope's intensity control, in this case fitted just to the
right of the c.r.t, screen at the top of the panel, should normally
Figure 2.3 The Metrix OX71 Educational Oscilloscope - see text (reproduced by
courtesy of Chauvin Arnoux)
12 Oscilloscopes
be used at the lowest setting that gives an adequately bright trace.
In particular, if the external X input is selected and no X and Y
signals are applied, the spot will remain stationary; if the intensity
control were then left at too high a setting for a long period,
permanent damage to the screen could occur in the form of a
'burn mark' (an area of reduced screen sensitivity). On the other
hand, if examining in detail say a 10 ~s long pulse occurring once
every 500 ~s, it would be necessary to advance the intensity
control. This is because, with a suitable timebase setting such as
2 us/division, the spot would spend only one-twenty-fifth of the
time writing the trace, and the rest of the time waiting to trigger
from the next pulse. But it will be found that, on advancing the
intensity control, the trace becomes not only brighter, but thicker.
This coarsening of the trace can be largely corrected by
adjustment of the focus control, the optimum setting of which
depends therefore to some extent on the setting of the intensity
control. There is a limit to just how much the intensity can be
increased to compensate for low repetition rate of the trace. For
example, in the case mentioned above, if the 10 Us pulse occurred
once every 20 ms it would not be possible to examine it on a basic
oscilloscope. One would require an instrument with a much
higher 'writing speed', a concept more fully explained in later
chapters.
Below the intensity control to the right of the screen is the
focus control, just above the ON/OFF Indicator and Switch. This
control should be adjusted to give the smallest spot size, resulting
in the sharpest possible trace. It may need readjustment when
viewing low duty cycle waveforms, as explained above. The
graticule has the usual ten divisions in the horizontal direction by
eight in the vertical, each division being one centimetre.
To the right of the intensity control knob is a hole providing
access to a preset control. This is the trace rotation control, which
enables the trace (which should of course be a horizontal straight
line in the absence of a Y input) to be set exactly horizontal. At the
top of the front panel, to the right of the trace rotation control
access hole, is the vertical shift control, labelled POSITION with a
vertical double ended arrow. To the right of that again is the
horizontal shift control, labelled POSITION with a horizontal