tài liệu môn bệnh cây: bệnh héo rũ mốc trắng HRGMT TK18p
Bạn đang xem bản rút gọn của tài liệu. Xem và tải ngay bản đầy đủ của tài liệu tại đây (2.07 MB, 18 trang )
Pak. J. Bot., 39(5): 1849-1866, 2007.
COMPARATIVE GROWTH, MORPHOLOGICAL AND
MOLECULAR CHARACTERIZATION OF INDIGENOUS
SCLEROTIUM ROLFSII STRAINS ISOLATED FROM
DIFFERENT LOCATIONS OF PAKISTAN
DARAKHSHANDA KOKUB1, F. AZAM2*, A. HASSAN2, M. ANSAR2,
M. J. ASAD1 AND A. KHANUM1
1
Department of Biochemistry, University of Arid Agriculture, Rawalpindi,
2*
Nuclear Institute for Agriculture and Biology (NIAB), Faisalabad,
Presently Director, Nuclear Institute for Food and Agriculture (NIFA), Peshawar
Corresponding author e-mail:
Abstract
Growth rate of 8 fungal strains of Sclerotium rolfsii on potato dextrose agar plates at 28oC
ranged from 0.86-1.35 mm hour-1. Strains D4, D7 and D8 were found to be comparatively fast
growing and produced greatest number of sclerotia than others. All strains produced round shaped
sclerotia with average diameter of 0.5-2.0 mm. Mycelial compatibility reaction on PDA plates
showed that strains D5 and D7 as well as D3 and D8 were compatible with each other. Random
amplified polymorphic DNA (RAPD) analysis also revealed that strains D5 and D7 shared 94 %
similarity while strains D3 and D8 were 83% similar.
Introduction
Sclerotium rolfsii Sacc., is a soil borne plant pathogen causing diseases on a wide
range of agricultural and horticultural crops. It has wide geographic diversity and
commonly found in the tropics, subtropics and other warm temperate regions especially
the Southern United States, Central and South America, West Indies, Southern European
countries bordering the Mediterranean, Africa, India, Japan, Philippines and Hawaii
(Aycock, 1966). The first report of the fungus pathogenicity dates back to 1892 in
connection with tomato blight in Florida (Weber, 1931). The wide host range, prolific
growth and ability to produce persistent sclerotia contribute to the large economic losses
associated with this pathogen.
The fungus was placed in the form genus Sclerotium by Saccardo (1913) as it formed
differentiated sclerotia and sterile mycelium. The fungi included in this genus were
characterized by production of small tan to dark brown or black spherical sclerotia with
internally differentiated rind, cortex and medulla. S. rolfsii was reported as the best
known member of the genus by Punja & Damiani (1996).
The cultures of S. rolfsii originating from various plant species and different
geographical regions present wide variation in growth rate, morphological characteristics,
mycelial compatibility and also exhibited genetic variability. However, the cultures of S.
rolfsii can be identified by the size, color and structure of their sclerotia. The objective of
this study was to compare the growth behavior of indigenous fungal strains and to study
the morphological and genetic similarities and differences among different fungal strains
isolated from various locations of Pakistan.
DARAKHSHANDA KOKUB ET AL.,
1850
Table 1. Source/location of fungal strains of sclerotium rolfsii.
Strains
Source/location
D2
Dera Ismail Khan
D3
Fungus culture collection, University of the Punjab, Lahore.
D4
Dera Ismail Khan
D5
Chakwal
D6
NARC (Farmer Field)
D7
Chakwal
D8
NARC (Research Field)
D9
Dera Ismail Khan
Materials and Methods
Fungal strains used for the present study were obtained from National Agriculture
Research Council (NARC), Islamabad and Fungus Culture Collection, University of the
Punjab, Lahore. These cultures were originally isolated from leaves and stem of chickpea
infected plants from different localities of Pakistan identified as S. rolfsii and stored on
potato dextrose agar (PDA) slants (Table 1).
The fungal strains were further transferred/sub-cultured by growing on freshly
prepared PDA plates. The fresh PDA was prepared following the method described by
Sarma et al. (2002).
Morphological characterization
Growth behaviors of fungal strains on PDA plates: Ten mm diameter circular discs
taken from the margin of an actively growing (3-4 days old) colony was punched out
with the help of a self-designed cutter and placed onto the center of the plate with the
mycelial side facing downwards, under aseptic conditions. The plates were incubated at
28oC for 7 days.
Morphological characteristics such as: i) growth, ii) mycelium condition, iii) radial
colony diameter, iv) development of sclerotia, and v) color, type and location of sclerotia
for each strain were noted. The observations were recorded at 12 hours interval up to 3
days and then at 24 hours intervals for 7 days.
Mycelial compatibility/incompatability reaction on PDA plates: Eight fungal strains
of S. rolfsii were subjected to mycelial compatibility reaction on PDA plates in order to
identify the morphological similarities/differences among various strains as described by
Punja & Sun (2001). Eight fungal strains in combination of three at a time were tested. A
total of 56 combinations were prepared using the statistical formula:
N
Cn =
N!
(N − n)! n!
The PDA plates were marked into three portions. Ten mm diameter mycelial disc of
the respective strain was inoculated on each portion of PDA plate. After inoculation, the
plates were incubated at 28oC for 15-20 days and examined daily for the development of
clearing zone in the region of mycelial contact. All combinations were inoculated in
triplicate.
COMPARATIVE OF INDIGENOUS SCLEROTIUM ROLFSII STRAINS
1851
Molecular characterization
RAPD analysis: Genetic similarities and differences among eight strains of S. rolfsii was
assessed using randomly amplified polymorphic DNA (RAPD) analysis as described by
Punja & Sun (2001). DNA was extracted from the mycelial mat of each strain grown on
PDA plate for 7days at 28oC. Mycelium (200 mg) was transferred to 1.5 mL
microcentrifuge tubes containing liquid nitrogen. Subsequently, DNA was extracted by
the method of Punja & Sun (2001).
The mycelium was thoroughly ground into a fine homogenate using pallet pestle
mixer. Eight hundred µL of lysis buffer [200 mM Tris pH 8.0; 500 mM NaCl; 100 mM
ethylene diaminotetra acetic acid (EDTA) pH 8.0; 2.0 % sodium dodecyle sulphate
(SDS); 1% 2-mercaptoethanol] was added to the tubes, mixed well and incubated at 24oC
for 30 minutes. Afterwards 400µL extraction buffer (phenol/chloroform/isoamyl alcohol,
25/24/1, v/v/v) was added followed by gentle stirring on a vortex mixer till an emulsion
was formed. The emulsion was centrifuged at 6000 g for 5 minutes in a microcentrifuge
(Eppendorf, Germany) at room temperature. An aliquot of the upper aqueous layer (600
µL) was collected, mixed with an equal volume of extraction buffer and re-centrifuged.
The upper layer was discarded and to the lower aqueous layer 10 µL of RNase A (10 mg
mL-1) was added and the mixture was incubated at 37oC for 30 minutes. The DNA was
precipitated by addition of 2.5 volumes of ice cold ethanol (70%) and the tubes were
placed at -20oC for overnight. The mixture was centrifuged at 14 000 g for 30 minutes at
4oC, the pellet was collected and suspended in 70% ethanol and re-centrifuged. Finally,
the pellet was air-dried for 10-15 minutes, re-suspended in 100 µL of Tris-EDTA (TE)
buffer having 10 mM Tris-HCl (pH 8.0) 1 mM EDTA. The DNA concentration was
estimated by electrophoresis in 1% Agarose gel containing 0.05% Ethidium bromide. The
DNA concentration was estimated with reference to Lambda DNA marker under UV
illumination. The DNA concentration was further confirmed spectrophotometrically. The
stock solution of DNA was prepared at a final concentration of 1µg mL-1 and used at final
working concentration of 100 ng µL-1 for subsequent RAPD analysis.
Primer selection for DNA amplification: The GL decamer primers (Gene Link, USA)
set A and B were initially screened to detect polymorphism among 8 strains of S. rolfsii.
The GL Decamer set A indicated higher degree of polymorphism, were selected for the
diversity analysis studies. The DNA sequences (5’-3’) of all primers in GL decamer set A
used for DNA amplification are given in Table 2.
DNA amplification and agarose gel electrophoresis: The RAPD-PCR reaction was
carried out in 50µL volume. The PCR reaction contained 1 µL template DNA (100 ng
µL-1), 1 µL (4.5 pMol) of respective primers, 1 µL dNTPs (10 mM dNTP stock), 5 µL
PCR buffer (Tris HCl buffer), 5 µL Mg Cl2 (25 mM stock), 2.5 µL gelatin (1%) and taq
polymerase 0.5 µL of (5 units µL-1). Deionized water was used to make the total reaction
volume up to 50 µl. In order to ensure the reproducibility of the RAPD reaction,
appropriate negative controls (without DNA template) were also run.
PCR tubes were placed in thermocycler (Eppendorf, Germany) for DNA
amplification using the following temperature profile: DNA was denatured at 94oC for 4
minutes, forty cycles of 94oC for 1 minute, 36oC for 1 minute and 72oC for 2 minutes.
Following the cycling, mixture was incubated at 72oC for 10 minutes and then kept at 4oC
for 12 hours.
DARAKHSHANDA KOKUB ET AL.,
1852
S. No.
1
2
3
4
5
6
7
8
9
10
Table 2. RAPD primers and their sequences.
Primer name
Primer sequence (5’-3’)
A-01
CAGGCCCTTC
A-02
TGCCGAGCTG
A-03
AGTCAGCCAC
A-04
AATCGGGCTG
A-05
AGGGGTCTTG
A-06
GGTCCCTGAC
A-07
GAAACGGGTG
A-08
GTGACGTAGG
A-09
GGGTAACGCC
A-10
GTGATCGCAG
On completion of PCR amplification, the tubes were removed from the
thermocycler. After adding 5 µL of loading buffer (0.1% bromophenol blue, 0.05%
xylene cyanol FF and 30% glycerol), 15 µL of the RAPD product was loaded on 1%
agarose gel. Using TE buffer, electrophoresis was performed for 4 hours at 100 volts in
an electrophoresis apparatus (BioRad). The gel was stained with Ethidium bromide
(0.1%) and photographed under UV illumination.
The fungal isolates compared with each other using their RAPD-PCR profiles and
bands of DNA fragments were scored as present (I) and absent (0) for each of the
decamer primer used. For the data collection very very faint bands were not included.
Genetic similarity matrix was generated on the basis of similarity coefficients. A
dendrogram based on the similarity coefficients was constructed by using un-weighted
pair group method of arithmetic means (UPGMA) as described by Nei & Lis (1979).
Results and Discussion
Morphological characterization of different strains: Morphological characteristics of
8 fungal strains grown on PDA plates revealed that mycelial growth rate of different
strains varied considerably upto three days. Mycelia of most strains showed growth along
the surface of the medium that was lying to the base (LTB) while a few strains showed
fluffy (F) appearance i.e. mycelia were growing at right angle to the surface of the plate.
The whole plate was covered with mycelium within 3 days. Linear /apical growth of
mycelia on PDA plates at 28oC ranged from 0.86-1.35 mm hour-1 (Table 3). Barnett
(1968) observed that growth and branching of S. rolfsii filamentous fungi occurred at the
apex of mycelium and pointed out that growth was regulated by a delicate balance
between cell wall synthesis and degradation. Further, it was noted that two enzymes viz.,
β 1-3 glucanase and glucane synthetase were responsible for this activity. However,
equilibrium of these two enzymes controlled the hyphal growth and branching in S. rolfsii
as studied by Kritzman et al., (1978).
The formation of sclerotia initiated after 72 hours of incubation and continued till
168 hours. Initially, white colored sclerotia were formed. Then their color changed from
white to off-white, light brown and dark brown as they attained maturity. After utilization
of nutrients, the plates became dry. However, dark brown and black coloured sclerotia
survived for longer times. The change in color of sclerotia might also be due to
utilization/exhaustion of nutrients.
COMPARATIVE OF INDIGENOUS SCLEROTIUM ROLFSII STRAINS
1853
1854
DARAKHSHANDA KOKUB ET AL.,
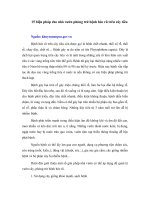
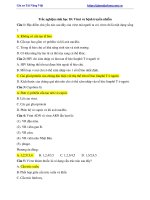
The color and arrangement of sclerotia on agar plates were different for different
strains (Fig. 1). The sclerotia of strain D2 and D4 were arranged as peripheral ring on the
plate. Initially, white colored sclerotia were produced which later on transformed into light
brown and then dark brown. It was observed that these strains were not only fast growing
but also produced maximum number of sclerotia on PDA plates i.e., approximately 1210
and 950 per plate, respectively. In case of strains D7 and D8 there was heavy vegetative
growth showing fluffy appearance of mycelia and the sclerotia were embedded within the
mycelium. The white/off-white sclerotia of strain D8 formed a ring in the centre of the plate
while, the sclerotia of strain D7 were off-white/light brown in color and scattered on the
plates. Strain D9 produced a ring of off-white to light brown sclerotia in the centre of the
plate whereas sclerotia of D6 were arranged as peripheral ring. Strain D5 produced offwhite/light brown sclerotia scattered throughout the plate. Strain D3 produced minimum
number of sclerotia on agar plates i.e., approximately 150 per plate. Strain D3 was found to
be comparatively slow growing and the production and arrangement of sclerotia was
entirely different from other strains. These were produced in the form of bunches only at
the site of inoculation with marginal mycelial growth (Fig. 1).
During the present study, it was observed that the sclerotia of these strains were
mostly round in shape. The sclerotial diameter of 9 fungal strains ranged from 0.5-2.0
mm. However, the average sclerotial diameter of 1.0 ± 0.2 mm at 20oC was recorded by
Punja & Damiani (1996). Production of small, spherical and tan to dark brown and black
colored sclerotia were also reported by Zarani & Christias (1997) and Sarma et al.,
(2002). The number of sclerotia produced by different strains was different and ranged
from 91-1210 per plate (Table 3). In another study done by Punja & Damiani (1996)
reported that greatest number of sclerotia (1043 ± 340) was produced by S. rolfsii on
PDA plates at an incubation temperature of 35oC.
It was further observed in our studies that strains with heavy mycelial growth
produced more number of sclerotia. Therefore, strains D4, D7 and D8 were found to be
comparatively fast growing, producing more number of sclerotia on agar plates. These
findings were consistent with the earlier investigations made by Wheeler & Sharan
(1965) and Zoberi (1980) that media which supported extensive growth also produced
greatest number of sclerotia.
Moreover, sclerotia of some strains showed shiny appearance due to presence of
gummy material on their surface. The presence of gummy material on the surface of
sclerotia might be due to the production of extracellular polysaccharides by these strains.
Flieger et al., (2003) reported that filamentous fungi were very promising producer of β
D-glucan as the hyphal cell wall and extracellular matrix contain more than 75%
polysaccharides.
Earlier studies on sclerotia formation by S. rolfsii revealed that a large number of
factors were responsible for production of sclerotia such as some nutritional and non
nutritional factors (Trevethick & Cooke, 1971), nutrient depletion (Hadar et al., 1983),
restriction of growth by a physical barrier (Wheeler & Waller, 1965), as well as by
imposing a step down in the level of nitrogen following active growth (Punja, 1986).
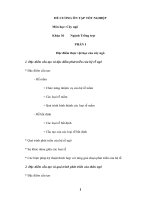
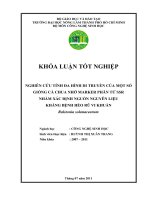
In the present study, it was observed that if a contaminant (bacterial or fungal) came
into contact with S. rolfsii strain on agar plate, a number of sclerotia developed around
the contaminant and blocked its further growth and proliferation as shown in Fig. 2.
However, by producing large number of sclerotia, the fungal cells were protected.
Therefore, some times sclerotia might be developed as a part of defense mechanism.
COMPARATIVE OF INDIGENOUS SCLEROTIUM ROLFSII STRAINS
D2
D3
D4
D5
D6
D7
D8
D9
Fig. 1. Growth of eight fungal strains on PDA plates after 20 days of incubation at 28oC.
1855
DARAKHSHANDA KOKUB ET AL.,
1856
Fig. 2. Production of sclerotia by S. rolfsii strains D5 and D9 in response to contaminants.
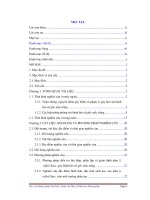
Mycelial incompatibility (a)
Mycelial incompatibility (b)
Fig. 3. Comparison of (a) incompatible reaction (top and bottom) with (b) compatible reaction (top
and bottom) among different strains of S. rolfsii on PDA plates after 20 days of incubation at 28oC.
COMPARATIVE OF INDIGENOUS SCLEROTIUM ROLFSII STRAINS
1857
Mycelial compatability/in compatability among different strains: After inoculation
and growth of three different strains on one plate, it was observed that as the colony size
increased, their mycelia came in contact with each other. Initially, intermingling of the
mycelia of two incompatible strains took place but later on lysis of mycelia of two strains
and development of a clear zone was observed at the region of interaction (mycelial
contact). The mycelial incompatibility reaction is shown in Fig. 3a (top and bottom). It
was observed that strain D3, D5 and D6 while growing on the same plate developed
clearing zone between strain D3 and D5, D3 and D6 as well as between D5 and D6 (Fig.
3a, top). However, sometimes production of sclerotia by incompatible strains was also
observed along the sides of the clearing zone as shown in Fig. 3a (bottom). Strain D5, D8
and D9, when grown on the same plate, developed clearing zone between strains D5, D8
and D8, D9 as well as between D5, D9. It was further observed that strains D5, D8 and
D9 also produced sclerotia along both sides of the clearing zone. Therefore, strains D5,
D8 and D9 also showed incompatible reaction between themselves. On the other hand,
when two compatible strains came in contact with each other, mycelia of both strains
intermingled and sclerotia were also produced at the region of interaction, however,
development of clearing zone was not observed. For example, when strains D5, D7 and
D6 came in contact with each other, the mycelia of D5 and D7 intermingled without the
development of clearing zone as shown in Fig. 3b (top). However, D6 on contact with
D5 and D7 developed clearing zone at the region of interaction and sclerotia were also
developed. Therefore, strain D6 showed mycelial incompatibility with strain D5 and D7
while strains D5 and D7 showed mycelial compatibility between them. Similarly, strains
D3 and D8 showed compatible reaction between each other whereas D9 showed
incompatible reaction with strain D3 and D8 as shown in Fig. 3b (bottom). Therefore, the
study revealed that mycelial compatibility/incompatibility reaction could be used to
distinguish morphologically different strains belonging to the same species. Mycelial
compatibility/ incompatibility reaction by different species was also reported by Punja &
Sun (2001) and Sarma et al., (2002).
Among the 56 combinations, 12 combinations showed mycelial compatibility
between two strains. On the basis of mycelial compatibility behavior two pairs i.e. D3 D8
and D5 D7, were found similar to each other. It was further observed that strains D3 and
D8 when paired with all other strains showed mycelial compatibility between them.
Similarly, strains D5 and D7 also showed mycelial compatibility when paired with other
strains. However, the remaining strains showed incompatible reaction.
The earlier workers also observed that when mycelia of different isolates belonging
to the same species confront with one another, either on agar media or a suitable growth
substrate, a distinct zone of demarcation (barrage or aversion zone) was developed
between the colonies. Recognition of non-self from self is the underlying basis of the
incompatible reaction (Punja & Sun, 1997). Mycelial compatibility reaction was also
used by Sarma et al., (2002) to study variability and relatedness among fungal species
belonging to different geographical regions.
Molecular characterization
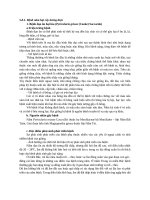
RAPD analysis: DNA of 8 fungal strains of S. rolfsii was amplified using 10 random
decamer primers. Out of the 10 primers used, 9 could detect polymorphism while one
primer (A-10) produced monomorphic pattern. Primer A-01 amplified a total of 17 bands
corresponding to 2500-250 base pairs (bp). Out of these, 12 were polymorphic. The
polymorphic bands have been indicated by stars as shown in Fig. 4. Primer A-02
amplified 6 bands out of which 4 were polymorphic (Fig. 5). Primer A-03 amplified 13
1858
DARAKHSHANDA KOKUB ET AL.,
Fig. 4. RAPD of eight fungal strains using A- 01 primer.
Left-right Lane 1:10, 1kb DNA marker (M). Lane 2-9: Randomly amplified DNA of fungal strains.
Polymorphic bands are pointed as *
Fig. 5. RAPD of eight fungal strains using A- 02 primer.
Left right Lane 1: 10, 1kb DNA marker (M). Lane 2-9: Randomly amplified DNA of fungal strains.
Polymorphic bands are pointed as *
COMPARATIVE OF INDIGENOUS SCLEROTIUM ROLFSII STRAINS
1859
bands, out of which 4 were polymorphic. One amplification product approximately
corresponding a to 700 base pairs (bp) was observed in strains D2, D4, D6 and D9 while
one band corresponding to 500 bp was amplified only in strain D8. Based on this band,
primer A-03 could be used to differentiate strain D8 from other strains as shown in Fig. 6.
Random decamer primer A-04 amplified total of 11 bands out of which 4 were
polymorphic. However, one band corresponding to 250 bp was present in all strains
except D8. The banding pattern is shown in Fig. 7. Primer A -05 amplified 13 bands, 6 of
them were polymorphic. One band corresponding to about 300 bp was observed only in
D6 which could be used to differentiate strain D6 from other strains on the basis of this
particular band as shown in Fig. 8. Moreover, one band corresponding to about 800 bp
was absent in strain D3, D5, D6 and D8. Primer A-06 amplified a profile of 15 bands, out
of which 13 were polymorphic. By using this primer, one amplicon corresponding to
about 700 bp was observed only in strain D3 as shown in Fig. 9. Therefore, random
decamer A-06 can be used to differentiate D3 from other strains. Primer A-07 amplified
12 bands, out of that 8 were polymorphic. This primer amplified one band corresponding
to 2500 bp which was specific for D8. The banding pattern is shown in Fig. 10. Primer A
-08 produced a profile of 13 bands containing 10 polymorphic bands. This primer
amplified D6 and D8 specific bands, therefore, primer A-08 could be used for
identification of these strains (Fig. 11). Maximum of 6 bands could be scored with Primer
A -09, out of which 3 were polymorphic. Absence of amplification product
corresponding to about 600 bp in strain D6 indicated genetic variation of this strain from
others as shown in Fig. 12. Random decamer primer A-10 amplified 10 bands which
showed almost monomorphic banding pattern for all strains investigated for genetic
variation except one polymorphic band for strain D3 corresponding to about 800 bp was
amplified by this primer as shown in Fig. 13.
Collectively 116 bands were produced, with an average of 11.6 bands per primer.
Out of these amplified products 64 (55.17%) were polymorphic. Maximum number of
bands i.e., 91 was amplified by the fungal strain D4 followed by 85 by strains D2 and D5
each, while minimum number of bands i.e., 79 and 81 were amplified by the fungal
strains D9 and D6, respectively.
Data, in the form of one (1) or zero (0), based on the presence or absence of a
particular band, was used for the estimation of similarity matrix (Table 4) to calculate
genetic divergence and relatedness among Sclerotium rolfsii strains isolated from various
localities of Pakistan. Genetically most similar strains were D5 and D7 (94.44%) and D3
and D8 (83.52%) similar while the most distant strains were D2 and D7 (81.69% similar).
Cluster analysis (dendogram) as shown in Fig. 14 prepared by using Nei & Li’s
coefficients, showed that fungal strains of S. rolfsii could be clustered into two groups.
Cluster I comprising of D3 and D8 showed similarity of 83.52% while cluster II
contained 6 strains i.e., D2, D4, D5, D6, D7 and D9 with similarity range of 83.75 to
94.44%. The two groups joined at a similarity level of 81.26%. Dendrogram depicted that
in group I genetically, most similar isolates were D5 and D7 (94.44%) however, strains
D5, D7 and D4 were 91.17% similar whereas D5, D7, D4 and D9 shared similarity of
88.70%. The dandogram further depicted that D5, D7, D4, D9 and D6 were 89.56%
similar while D5, D7, D4, D9, D6 and D2 were 83.75% similar. On the whole, all strains
were 81.26% similar to each other and only 18.74% variation existed among them. It was
also confirmed by RAPD analysis that strains D5 and D7 were 94.44% similar while
strains D3 and D8 were 83.52% similar.
1860
DARAKHSHANDA KOKUB ET AL.,
Fig. 6. RAPD of eight fungal strains using A- 03 primer.
Left-right Lane 1: 10, 1kb DNA marker (M). Lane 2-9: Randomly amplified DNA of fungal strains.
Polymorphic bands are pointed as *
Fig. 7. RAPD of eight fungal strains using A- 04 primer.
Left-right Lane 1: 10, 1kb DNA marker (M). Lane 2-9: Randomly amplified DNA of fungal strains.
Polymorphic bands are pointed as *
COMPARATIVE OF INDIGENOUS SCLEROTIUM ROLFSII STRAINS
1861
Fig. 8. RAPD of eight fungal strains using A- 05 primer.
Left-right Lane 1: 10, 1kb DNA marker (M). Lane 2-9: Randomly amplified DNA of fungal strains.
Polymorphic bands are pointed as *
Fig. 9. RAPD of eight fungal strains using A- 06 primer.
Left-right Lane 1: 10,1kb DNA marker (M). Lane 2-9: Randomly amplified DNA of fungal strains.
Polymorphic bands are pointed as *
1862
DARAKHSHANDA KOKUB ET AL.,
Fig. 10. RAPD of eight fungal strains using A- 07 primer.
Left-right Lane 1: 10, 1kb DNA marker (M). Lane 2-9: Randomly amplified DNA of fungal
strains. Polymorphic bands are pointed as *
Fig. 11. RAPD of eight fungal strains using A- 08 primer.
Left- right Lane 1: 10, 1kb DNA marker (M). Lane 2-9: Randomly amplified DNA of fungal
strains. Polymorphic bands are pointed as *
COMPARATIVE OF INDIGENOUS SCLEROTIUM ROLFSII STRAINS
1863
Fig. 12. RAPD of eight fungal strains using A- 09 primer.
Left-right Lane 1: 10, 1kb DNA marker (M). Lane 2-9: Randomly amplified DNA of fungal strains.
Polymorphic bands are pointed as *
Fig. 13. RAPD of eight fungal strains using A- 10 primer. Left-right Lane1: 10, 1kb DNA marker
(M). Lane 2-9: Randomly amplified DNA of fungal strains. Polymorphic bands are pointed as *
DARAKHSHANDA KOKUB ET AL.,
1864
Table 4. Similarity matrix for Nei and Li's coefficient for eight fungal strains of S. rolfsii.
D2
D3
D4
D5
D6
D7
D8
D9
D2
1
0.8291
0.8413
0.8519
0.8174
0.8674
0.8169
0.8647
D3
D4
D5
D6
D7
D8
D9
1
0.8459
0.5803
0.7759
0.8312
0.8352
0.7968
1
0.8998
0.8952
0.9236
0.8591
0.8877
1
0.8457
0.9444
0.8809
0.8747
1
0.8592
0.7939
0.8440
1
0.8984
0.9012
1
0.8223
1
Fig. 14. Dendrogram of eight fungal strains constructed from RAPD data using unweighted pair
group method of arithmetic means (UPGMA)
The data obtained under this experiment confirmed the efficiency of RAPD-PCR
technique for determination and estimation of genetic similarities and differences among
fungal strains collected for the present study. Therefore, RAPD analysis was found to be
an informative DNA marker system to assess genetic relatedness and diversity among
different strains (Tanwir et al., 2007; Asif et al., 2005).
RAPD-PCR analysis had also been used by other workers to investigate genetic
variation among isolates of S. rolfsii collected from different geographical regions. Punja
& Sun (1997) compared 128 isolates of S. rolfsii from 36 host species and 23 geographic
regions by means of random amplified polymorphic DNA (RAPD) polymerase chain
reaction (PCR) which confirmed that many isolates from the same host belongs to the
same mycelial compatibility group (MCG). The variation among 30 isolates of S. rolfsii
COMPARATIVE OF INDIGENOUS SCLEROTIUM ROLFSII STRAINS
1865
from different hosts and regions of Brazil was studied by Almeida et al., (2001) by
undertaking analysis of genomic DNA through random amplified polymorphic DNA
(RAPD–PCR) technique. These techniques confirmed that there was considerable
variability among isolates in relation to the number, size and location of sclerotia on the
surface of medium.
Acknowledgement
We are highly thankful to National Agricultural Research Council (NARC),
Islamabad and Fungus Culture Collection, University of the Punjab for provision of
strains of S. rolfsii.
References
Almeida, A.M.R., R.V. Abdelnoor, E.S. Calvo, D. Tessnman and J.T. Yorinori. 2001. Genotypic
diversity among Brazilian isolates of Sclerotium rolfsii. J. Phytopathol., 149(9): 493-502.
Asif, M., M. Rehman and Y. Zafar. 2005. DNA fingerprinting studies of some wheat (Triticum
aestivum L.) genotypes using random amplified polymorphic DNA (RAPD) analysis. Pak. J.
Bot., 37(2): 271-277.
Aycock, R. 1966. Stem rot and other diseases caused by Sclerotium rolfsii or the status of Rolf’s
fungus after 70 years. N. C. Agr. Expt. Stn. Tech. Bul., No. 174: pp. 202.
Barnett, J.H. 1968. The hyphal tip. In: J. H. Burnett (Eds.). Fundamentals of mycology. Edward
Arnold Publishers Ltd., London. P. 49-51.
Flieger, M., M. Kantorova, T. Benesova, S. Pazoutova and J. Votruba. 2003. Kinetics of soluble
glucan production by Claviceps viridis. Folia Microbiol., 48(5): 633-638.
Hader, Y., M. Pines, I. Chet and Y. Henis. 1983. The regulation of Sclerotium initiation in
Sclerotium rolfsii by glucose and cyclic AMP. Can. J. Microbiol., 29: 21-26.
Kritzman, G., I. Chet and Y. Henis. 1978. Localization of β (1-3) glucanase in the mycelium of
Sclerotium rolfsii. J. Bacteriol., 134(2): 470-475.
Nei, N. and W. Li. 1979. Mathematical model for studying genetic variation in terms of restriction
endonucleases. Proc. Natl. Acad. Sci. USA., 76: 5269-5273.
Punja, Z.K. 1986. Effect of carbon and nitrogen step down on Sclerotium biomass and cord
development in Sclerotium rolfsii and Sclerotium delphinii. Trans. Br. Mycol. Soc., 86 (4):
537-544.
Punja, Z. K. and A. Damiani. 1996. Comparative growth, morphology and physiology of three
Sclerotium species. Mycologia, 88(5): 694-706.
Punja, Z.K. and L.J. Sun. 1997. Genetic diversity among mycelial compatibility groups of
Sclerotium rolfsii and Sclerotium delphini. Programme and summaries of the 11th biennial
conference of the Australian Plant Pathology Society, 29th September- 2nd October, Perth,
Australia, pp.110.
Punja, Z.K. and L.J. Sun. 2001. Genetic diversity among mycelial compatibility groups of
Sclerotium rolfsii (telemorph Athelia rolfsii) and S. delphenii. Mycol. Res., 105(5): 537-546.
Saccardo, P.A. 1913. Sclerotium rolfsii. Sylloge Fungorum 22. Pavia, Italy, p. 1500.
Sarma, B. K., U.P. Singh and K.P Singh. 2002. Variability in Indian isolates of Sclerotium rolfsii.
Mycologia, 94(6): 1051-1058.
Tanwir, A.M., A. Iqbal, M.A. Chowdhry, M. Kashif and S.U. Rehman. 2007. DNA marker for leaf
rust disease in wheat. Pak. J. Bot., 39(1): 239-243.
Trevetchick, J. and R.C. Cooke.1971. Effects of some metabolic inhibitors and sulphur containing
amino acids on sclerotium formation in Sclerotium rolfsii, S. delphnii and Sclerotinia
sclerotorium. Trans. Br. Mycol. Soc., 57: 340-342.
1866
DARAKHSHANDA KOKUB ET AL.,
Weber, G.F. 1931. Blight of carrots caused by Sclerotium rolfsii, with geographic distribution and
host range of the fungus. Phytopathol., 21: 1129-1140.
Wheeler, B.E.J. and N. Sharan .1965. The producion of sclerotia by Sclerotium rolfsii. I. Effects of
varying the supply of nutrients in an agar medium. Trans. Br. Mycol. Soc., 48: 291-301.
Wheeler, B.E.J. and J.M. Waller. 1965. The production of sclerotia by Sclerotium rolfsii. II. The
relationship between mycelial growth and initiation of sclerotia. Trans. Br. Mycol. Soc., 48:
303-314.
Zarani, F. and C. Christensein. 1997. Sclerotial biogenesis in the basidiomycete Sclerotium rolfsii.
A scanning electron microscope study. Mycologia, 89(4): 592-602.
Zoberi, M. H. 1980. Some nutritional factors regulating formation of sclerotia of Sclerotium rolfsii.
Can. J. Bot., 58: 2484-2490.
(Received for publication 15 May 2007)