financial management group assignment report topic cdbeco financial analysis
Bạn đang xem bản rút gọn của tài liệu. Xem và tải ngay bản đầy đủ của tài liệu tại đây (967.59 KB, 22 trang )
UNIVERSITY OF ECONOMICS HO CHI MINH CITY
SCHOOL OF FINANCE
FINANCIAL MANAGEMENT
GROUP ASSIGNMENT REPORT
Topic:
CDBECO FINANCIAL ANALYSIS
Lecturer: Mrs. Tu Thi Kim Thoa
Class : IBC02
Group: 5
Members:
Bùi Nguyễn Phương Thảo - 31191024855
Võ Thu Thảo - 31191021217
Lê Dương Anh Tuấn - 31191025110
Hồ Thảo Vy - 31191025222
Nay Đinh Nhật Vỹ - 31201024701
⤺⤻⇜⇝⤺⤻
2021, October
TABLE OF CONTENTS
PART I: INTRODUCTION
Founding
Expansion
Organizational structure
The overall market
Competitors
2
3
3
4
5
5
PART II: ANALYSIS OF PROFIT/LOSS AND BALANCE SHEET
Balance sheet
Income statement
6
6
10
PART III: RATIO ANALYSIS
Liquidity ratio
Long-term solvency ratios
Efficiency ratio
Profitability ratio
Market value ratio
13
13
14
15
16
18
PART IV: CONCLUSION
IN EACH OF ASPECTS
IN GENERAL
18
18
20
PART V: REFERENCES
21
1
PART I: INTRODUCTION
Chuong Duong Beverage Joint Stock Company was formerly the Usine Belgique
factory belonging to B.G.I Group (France). This was the largest beverage factory in
the South before 1975. In mid-1977, BGI Group officially transferred ownership and
handed over the entire factory to the state with the name “Chuong Duong Soft Drink
Factory”. After many years of operation in the beverage industry, Chuong Duong is
currently one of the leading companies in Vietnam.
Company background1
Name
Chuong Duong Beverages Joint Stock
Company
Short name
CDBECO
Parents company
Saigon Beer - Alcohol - Beverage
Corporation (SABECO)
Postal address
606 Vo Van Kiet Street, Cau Kho Ward,
District 1, Ho Chi Minh City
Internet address
www.cdbeco.com.vn
Independent audit firm
KPMG Limited Vietnam
Tax code
0300584564
Stock code
SCD
1
Công Ty Cổ Phần Nước Giải Khát Chương Dương. Thongtindoanhnghiep.co. (2015). Retrieved 19 September
2021, from />
2
Listing floor
Ho Chi Minh City Stock Exchange
Industries served
Beverage
Geographic areas served
Vietnam
Current Chairman
Neo Gim Siong Bennett
a) Founding
Chuong Duong has been a familiar soft
drink brand to most people in the Southern part
of Vietnam for more than 60 years with its
unique sarxi flavor. Having been present in
Vietnam since the 1950s, but Chuong Duong
really marked an important turning point only
when officially operating as a joint stock
company on June 2, 2004 with a charter capital
of VND 85 billion. In that total amount, Saigon
Beer - Alcohol - Beverage Corporation
(SABECO) held 51% controlling stake.2
Currently, as of March 16, 2021, SCD's largest shareholder is still Sabeco with
62% of charter capital, followed by Venture Investment Joint Stock Company and
PYN Elite Fund holds 12.47% and 5.65% of charter capital respectively.
b) Expansion
Currently, the company is operating with a production line for extracting glass
bottles, a line for filling PET bottles and a line for filling cans; with over 500
employees working 2 shifts/day. The average output of the Company has grown
continuously from 2.7 million liters in the period 1977 - 1985 to 22.9 million liters in
1988 - 1992 and reached more than 38 million liters up to the present time.
According to CDBECO's 2020 financial report, the company's net revenue in
the year is about 259 billion VND and profit after tax is 12.8 billion VND, equivalent
to a decrease of 3% and 26% compared to the 2019 results.
Currently, the classification of small and medium-sized enterprises is based on
the average number of employees participating in social insurance per year and
revenue or capital source (with priority given to revenue). From the above
information, it can be seen that CDBECO is a medium-sized enterprise in the
manufacturing sector with more than 500 employees and 85 billion VND investment
capital.
2
Câu chuyện thương hiệu - Chương Dương. Retrieved 19 September 2021, from
/>
3
c) Organizational structure
The structure of CDBECO's Executive Board
Board of Directors
Mr. Neo Gim Siong Bennett
Chairman
Mr. Tran Duc Hoa
Member
Mr. Trinh Huy Hoa
Member
Mr. Dang Trung Kien
Member
Mr. Pham Tan Loi
Member
Majority-owned subsidiaries
No.
Name
Address
1
Branch of CD Beverage Joint
Stock Company in Nha Trang
40 2/4 Street, Vinh Hai Ward, Nha
Trang City
2
Sales and Distribution Center
176/5 Pham Hung Street, Block 1,
Ward 09, Ho Chi Minh City
3
Branch of Chuong Duong
Beverage Joint Stock Company
Lot D-5B, 5D, 5F-CN, My Phuoc
Industrial Park 3
4
Go Dau Branch - Chuong Duong
Beverage Joint Stock Company
280 Go Dau Street, Tan Quy Ward, Tan
Phu District, Ho Chi Minh City
4
d) The overall market
The company's business areas include:
● Producing and trading in beverages (mainly).
● Producing and trading in raw materials, packaging, equipment and technology
related to the beverage sector.
The company's main products include:
● Carbonated soft drinks (glass bottles, cans and PET bottles): sarxi, orange
flavor, strawberry flavor, mint, Cream soda, soda.
● Non-carbonated beverage: aloe vera flavor.
● Bottled purified water.
e) Competitors
Beverage is a commodity in the FMCG industry, it has great consumption in
the world with advantages of convenience and deliciousness. In Vietnam, the beverage
market is considered to have strong growth nationally. Currently, according to
estimates of the Vietnam Beer and Alcoholic Beverage Association (VBA), there are
about 1800 beverage production facilities in the country with an annual growth rate of
6-7%. Among them, prominent brands in the market can be listed as Coca Cola,
Pepsico, Vinamilk, Vinacafé, Trung Nguyen Coffee, Tan Hiep Phat Group, TRIBECO,
Lavie, Vinh Hao, Sanna Khanh Hoa,...
However, in this report, we choose Sanna Khanh Hoa Beverage JSC (SKN) as a direct
competitor based on the following criteria:
● Both Chuong Duong and Sanna Khanh Hoa are Vietnamese companies
operating in the field of beverage production.
● Sanna's most recent three-year financial statements is clear, audited by FAC
and available on the official web.
● Sanna has the same level of awareness and satisfaction as Chuong Duong in the
Vietnamese beverage market.
5
PART II: ANALYSIS OF PROFIT/LOSS AND BALANCE SHEET
a) Balance sheet
Through data collection and comparison with other companies in the same
FMCG industry that Chuong Duong Beverage is doing business in, our group chose
Sanna Khanh Hoa Beverage to compare with Chuong Duong, as a direct competitor.
According to the financial statements published by Chuong Duong Beverage
and Sanna Khanh Hoa companies for the years 2018, 2019 and 2020, respectively, we
have two balance sheets with the following absolute values. Besides, according to the
balance sheet in the financial statements announced by the company, Sanna Khanh
Hoa does not disclose long-term debts (non-current liabilities). Therefore, it is not
shown in Sanna Khanh Hoa's absolute balance sheet below.
Chuong Duong
In absolute value (VND)
2018
2019
2020
Asset
Current asset
192,566,273,595
206,885,924,503
182,251,660,440
Non-current asset
43,069,208,100
40,515,659,043
227,283,080,585
Total
235,635,481,695
247,401,583,546
409,534,741,025
Current liabilities
45,692,923,589
42,329,352,132
39,810,293,760
Non-current liabilities
720,000,000
8,401,218,750
176,266,087,207
Stockholders' equity
189,222,558,106
196,671,012,664
193,458,360,058
Total
235,635,481,695
247,401,583,546
409,534,741,025
Liabilities and Stockholders'
equity
Sanna Khanh Hoa
In absolute value (VND)
2018
2019
2020
Asset
Current asset
32,886,957,500
37,244,792,302
42,605,477,538
Non-current asset
33,213,123,992
26,474,857,605
21,371,836,006
Total
66,100,081,492
63,719,649,907
63,977,313,544
Current liabilities
15,419,199,164
12,419,317,443
10,251,113,847
Liabilities and Stockholders'
equity
Non-current liabilities
Stockholders' equity
none
50,680,882,328
none
51,300,332,464
none
53,726,199,697
6
Total
66,100,081,492
63,719,649,907
63,977,313,544
Because the size of each company is different, in this case we will compare the
ratios through the common-size balance sheet shown below, which also mentions the
changes in each year.
● Chuong Duong Beverage
Common-size balance sheet
Chuong Duong
In percentage
2018
2019
2020
Asset
Current asset
81.72
83.62
44.50
Non-current asset
18.28
16.38
55.50
Total
100.00
100.00
100.00
Current liabilities
19.39
17.11
9.72
Non-current liabilities
0.31
3.40
43.04
Stockholders' equity
80.30
79.49
47.24
Total
100.00
100.00
100.00
Liabilities and Stockholders' equity
Change in each year
Chuong Duong
In percentage
Change
Current asset
Non-current asset
From 2018 to 2019:
1.90
-39.12
From 2019 to 2020:
-1.90
39.12
Change
Current liabilities
Non-current
liabilities
Stockholders' equity
From 2018 to 2019:
-2.28
03.09
-0.81
From 2019 to 2020:
-7.39
39.64
-32.26
In this form, we can see that although current assets of Chuong Duong
Beverage increased slightly from 2018 to 2019 at about 1.9%, from 81.72 to 83.62%.
7
However, their current assets were 44.5% of total assets in 2020, down from 83.62%
in 2019, strongly decreased 39.12%. Current liabilities declined from 17.11 % to
9.72% of total liabilities and equity over the period of 2019-2020 – the time of
Covid-19. Total equity decreased from 74.49% of total liabilities and equity to
47.24%.
Overall, Chuong Duong Beverage’s current assets, current liabilities and total
equity all decreased after the Covid-19 shock. Thus, the company’s liquidity, as
measured by current assets compared to current liabilities, decreased over the year.
● Sanna Khanh Hoa
Common-size balance sheet
Sanna Khánh Hòa
In percentage
2018
2019
2020
Asset
Current asset
49.75
58.45
66.59
Non-current asset
50.25
41.55
33.41
Total
100.00
100.00
100.00
23.33
19.49
16.02
Liabilities and Stockholders' equity
Current liabilities
Non-current liabilities
none
none
none
Stockholders' equity
76.67
80.51
83.98
Total
100.00
100.00
100.00
Change in each year
Sanna Khánh Hòa
In percentage
Change
Current asset
Non-current asset
From 2018 to 2019:
8.70
-8.70
From 2019 to 2020:
8.14
-8.14
Change
Current liabilities Non-current liabilities Stockholders' equity
From 2018 to 2019:
-3.84
none
3.84
From 2019 to 2020:
-3.47
none
3.47
8
In this form, we can see that Sanna Khanh Hoa's current assets increase year by year
by over 8%. As we can see, from 2018 to 2019, their current assets rose from 49.75
percent to 58.45%, and despite the impact of the Covid-19 epidemic in 2020, the
company's current assets are still up 8.14 percent in that year, to 66.59% compared to
2019.
In addition, the company's current liabilities also decrease year by year by over 3.5%
per year. In 2020, despite being affected by the epidemic, they still decreased by
3.47%. At the same time, the company's total equity is still increasing year by year,
especially during the epidemic period, this number has increased by about 3.47%.
Therefore, in general, the above figures can be concluded that the company's cash
flow and liquidity are in good condition in the last 3 years.
● Chuong Duong Beverage and Sanna Khanh Hoa comparison:
It can be seen that, in the period of 2018 - 2019, current assets of Sanna Khanh
Hoa increased much faster than Chuong Duong Beverage (at 8.7% compared to a rate
of only 1.9%). During the Covid-19 pandemic in 2020, Chuong Duong Beverage's
current assets plummeted with 39.12%, from 83.62% of total assets to 44.5%.
Meanwhile, the decline rate of Sanna Khanh Hoa was only 8.7%, much lower than
Chuong Duong Beverage.
In addition, in terms of current liabilities, both companies have a decreasing
trend in the years from 2018 to 2020, in the period of 2019 - 2020, Chuong Duong
Beverage has a decrease of more than 2 times compared to Sanna Khanh Hoa (7.39%
compared to that of Sanna Khanh Hoa - about 3.47%). However, in terms of total
equity, Chuong Duong Beverage is decreasing year by year, while Sanna Khanh Hoa
is still growing, especially during the Covid-19 pandemic in 2020.
From that, it can be seen that, in normal state, the growth rate of current assets
of Chuong Duong Beverage is slower than that of Sanna Khanh Hoa, and when the
pandemic occurs, this stat decreases much more than the opponent. Although current
liabilities have decreased over the years, the total equity of Chuong Duong Beverage
has also kept that trend, while this index of Sanna Khanh Hoa - their direct competitor,
has increased over the years, despite the pandemic situation. complex. Therefore, it
can be concluded that Sanna Khanh Hoa has a liquidity advantage over Chuong
Duong Beverage, as measured by current assets compared to current liabilities, and
Sanna Khanh Hoa's balance sheet has grown “stronger” over the years.
9
b) Income statement
With an annual growth rate of the beverage market forecasted at 6% to 2020,
the beverage industry in Vietnam is one of the fastest growing FMCG sectors.
However, the complicated pandemic situation has prevented the development of many
industries, including the beverage market. Although domestic companies have tried to
cope with this change, there are still many difficulties.
As a case in point, Chuong Duong Beverage’s operating revenue has decreased
104,694,979,234 VND, about 39.2% compared to the previous year, 2019. The
reasons for this drop in revenue are supposed to be:
- The Covid-19 wave in 2020 has reduced the demand for consumer shopping.
- Covid 19 has disrupted the global supply chain, affecting the flow of goods.
- Insufficient supply due to production interruption.
However, this significant reduction has happened even before the Covid-19
spread widely in Vietnam. From 2017 to 2019, the operating revenues gradually went
down. From 327,297,597,399 VND in 2017, it decreased by 49,298,295,803 VND
(15.06%) in 2018 and continuously dropped to 267,086,490,066 VND. These datas
explain the company’s performance, which is getting worse over the years. There has
been a decline in units sold over the years, therefore, cost of goods sold (which are
directly tied to the production of the products, including the cost of labor, materials,
and manufacturing overhead) and total expenses also gradually went down.
Specifically,
● Cost of goods sold in 2017 was 327,297,597,399 VND, decreased
15,58% in 2018, 7.3% and 37.87% in 2019 and 2020 respectively. In
2020, the year of difficulties for most industries, the cost of goods sold
10
of Chuong Duong Beverage was 74,892,892,159 VND, approximately
77.11% smaller than that in 2017.
● Similarly to the cost of goods sold, total expenses experienced a
downward trend during the 2017-2020 period. During 4 years from 2017
to 2020, total expenses were 90,994,719,162 VND, 78,314,146,099
VND, 66,514,529,427 VND, 53,199,281,264 VND respectively. In other
words, the total expenses lessened around 15% annually.
Besides manufacturing and trading soft drinks, the company also invests in real
estate and producing things related to the beverage sector such as raw materials,
packaging, equipment and technology. These activities give the company both gains
and losses every year.
The year 2018 witnessed a significant increase in the total non-operating gains
2,201,607,931 VND compared to just about 446,371,020 VND in 2017 (a 393,22%
rise). This data showed that the company was making positive changes thanks to the
reduction of expenses such as sales, corporate management and financial expenses.3 In
addition, the company also invested in real estate projects such as the land plot in My
Phuoc and Vo Van Kiet. From the year 2018 onwards, the amount of non-operating
gains steadily decreased to the present, 495.67% and 45.11% respectively.
However, the figure for non-operating losses showed an opposite pattern. From
2017 to 2019, it kept increasing from 521,395 VND to 5,524,979 VND and reached a
peak at 502,884,966 VND. This was the result of the construction of a new factory in
Dong Nai Province that commenced at the end of 2019. In the following year, the
amount of non-operating losses was estimated at 236,516,599 VND, a decrease of
3
Quang Thang. (2018, October 20). “Vua” Sá Xị Chương Dương đang trở lại? ZingNews.vn. Retrieved
September 24, 2021, from />
11
50% compared to 2019 because the company must focus on recovering from the
impact of the pandemic. Overall, it is clear that the non-operating gains over years is
always higher than non-operating losses but the company has to put more efforts to
achieve the best results.
Different from Chuong Duong Beverages, Sanna Khanh Hoa has less
non-operating activities. That is the reason why Sanna Khanh Hoa’s operating gains
are much lower than Chuong Duong.
It is clearly stated that the gap between non-operating gains of Chuong Duong
and Sanna Khanh Hoa is large. In this aspect, while Chuong Duong had 446,371,020
VND in 2017 and always greater than 500 million VND, it even peaked at
2,201,607,931 VND in 2018; Sanna Khanh Hoa had the highest non-operating gains
was only 200,124,234 VND during that 4 year period.
Sanna Khanh Hoa hadn't put too much effort on investing in non-operating activities.
As a result, the company didn’t bear any losses in this area.
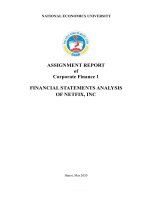
Mentioning how these 2 companies’ cost of sales and Gross profit proportion,
we have: Over the last 3 years, Sanna Khanh Hoa has gained a positive growth
compared to Chuong Duong.
12
From the year 2018 onwards, it seems like the amount of COGS and Gross
Profit allocated for Chuong Duong experienced a stabilities at around 75%, while the
COGS portion of Sanna Khanh Hoa reduced little by little through 3 years. In detail,
the proportion of cost reduced from 73,49% to 69,11% in 2019 and 65,33% in 2020.
With this decline in cost of sales, Sanna Khanh Hoa company seems to have
efficiently produced the revenue, therefore they are likely to have more spending
money for business operations.
PART III: RATIO ANALYSIS
a) Liquidity ratio
The tables below compare 3 different liquidity ratios of CDBECO and Sanna
Khanh Hoa.
Table a
CDBECO
Liquidity Ratio
Year
Current
ratio
Annual
percentage
change
Quick ratio
Annual
percentage
change
Cash ratio
Annual
percentage
change
2020
4,58
-6,33%
3,66
-18,57%
1,08
7,97%
2019
4,89
15,98%
4,50
19,01%
1,00
-16,51%
2018
4,21
17,54%
3,78
21,15%
1,20
50,26%
2017
3,59
-
3,12
-
0,80
-
Table a’
SKN
Liquidity Ratio
Year
Current
ratio
Annual
percentage
change
Quick ratio
Annual
percentage
change
Cash ratio
Annual
percentage
change
2020
4,16
38,59%
4,16
38,59%
0,88
26,71%
2019
3,00
40,61%
3,00
40,61%
0,70
59,93%
2018
2,13
-
2,13
-
0,44
-
● CDBECO:
The current ratios for CDBECO from 2017 to 2020 are generally high,
showing a large investment in the company’s net working capital. These figures
also experienced a rapid increase from 3.59 in 2017 to 4.89 in 2019 before a slight dip
of 6.33%, down to 4.58, in 2020. The 2020 current ratio is 4.58, meaning that it has
13
4.58 VND in current assets for every 1 VND in current liabilities. This is affected by
various types of transactions within the year, one of which may be due to the large
sudden rise in long-term debt of CDBECO: from a total of 720 million VND in 2017
and 2018, to 8,400 million in 2019 (more than 10 times), and 176 billion in 2020
(more 200 times), while total current liabilities just change slightly (see …).
CDBECO is a company in the FMCG industry so the quality of inventory is
strictly considered. In case the beverage products of CDBECO become damaged,
obsolete, or lost, the quick ratio is more preferable to evaluate liquidity of a company.
Quick ratios of CDBECO in 2018 and 2019 experience a quite similar trend with
current ratios: rapid rises, but there was much deeper low in percentage change in
2020 (at 3.66, dropped by nearly one-fifth of the previous year). This is perhaps
another cause for the high current ratio as already stated.
The final index in this category is cash ratio. It can be seen that in 2018, the
index rose by over half of the previous year to 1.2. Then it decreased by about 16.5%
before going back to 1.08 in 2020. This was true when the cash of CDBECO was just
less than 53 billion in 2018, but it was around 42.5- 43 billion VND in 2017,2019 and
2020. The event showed that there was a great amount of retained earnings from
2017’s operation, but much less in the next consecutive years.
● Sanna Khanh Hoa
Table a’ shows different liquidity ratios for Sanna Khanh Hoa from 2018 to
2020. Overall, figures for Sanna Khanh Hoa are lower than CDBECO in every
corresponding ratio, implying that it’s less capable of dealing with short-term
liabilities.
However, the figures also show a more stable trend of growth for Sanna
Khanh Hoa. For the current ratio of Sanna Khanh Hoa, the number steadily rose by
around 40% each year from 2.13 in 2018 to 4.16 in 2020. Figures for the quick ratio
moved in the same pattern, with an increase of 37% each year. The cash ratio also
increased throughout the years, but it was much less significant in 2020 than in 2019.
b) Long-term solvency ratios
Table b
CDBECO
2017
2018
2019
2020
Total Debt Ratio
0,29
0,25
0,26
1,12
Annual percentage change
-
-16,21%
5,16%
333%
Table b’
14
SKN
2018
2019
2020
Total Debt Ratio
0,3
0,24
0,19
Annual percentage change
-
-20,43%
-21,19%
● CDBECO
Looking at the capital structure of Chuong Duong can help give a better understanding
of its financial status. The total debt ratio for the company in each year from 2017 to
2020 was 0.29, 0.25, 0.26, and 1.12 respectively. It is obvious that there was little
change during the first 3 years, but a more than fourfold increase in the last year of the
period. As mentioned, this is attributed to the dramatic rise in long-term debt of the
firm, and it can be perceived that CDBECO was trying to restructure its capital.
● Sanna Khanh Hoa
The capital structure of Sanna Khanh Hoa was similar to that of CDBECO to some
extent, except that it had no long-term debt, and that there was a downward trend in
debt-equity ratio during the 3 year period (shown in table b’).
c) Efficiency ratio
Table c
CDBECO
Efficiency, or AU, or Turnover, Ratios
Year
Inventory
turnover
Annual
percentage
change
DSI
Annual
percentage
change
TA turnover
Annual
percentage
change
2020
3,36
-71,76%
108,52
254,06%
0,40
-63,27%
2019
11,91
11,44%
30,65
-10,27%
1,08
-8,50%
2018
10,69
6,05%
34,16
-5,70%
1,18
-13,48%
2017
10,08
36,22
1,36
Table c’
SKN
Efficiency, or Turnover, Ratios
15
Year
Inventory
turnover
Annual
percentage
change
DSI
Annual
percentage
change
Annual
TA turnover percentage
change
2020
6,89
-47,94%
53,01
92,07%
1,39
-34,05%
2019
13,23
-34,14%
27,60
51,83%
2,10
-9,79%
2018
20,08
-
18,18
-
2,33
-
● CDBECO
Table c shows the main efficiency ratios for CDBECO during the 4-year period. Data
in the first column express that Inventory Turnover was normally around 10 - 12 in
2017, 2018 and 2019. However, it was only 3.36 in 2020, a nearly 72% plunge. If
taking 365 (days) divided by figure for each year, Days’ sales in Inventory (DSI) can
be obtained as seen in the third column of the table. The company took more than 108
days on average to collect sales back from the current inventory in 2020, more than
triple that of the previous 3 years’ DSI. Total Assets Turnover Index was relatively
low in 2020 as well, at 0.4 following a continuous drop from 1.36 in 2017. With this
rate in 2020, it would take CDBECO 2.5 years for 1 VND in assets to create 1 VND in
sales. All of these reveal that CDBECO was witnessing a severe problem in sales
performance or inventory management during 2020. {{Note: They should have
better-selling models}}
● Sanna Khanh Hoa
Looking at figures in table c’, and comparing, in 2019 and especially 2020, it was
harder and harder for the company to sell off its inventory. DSI, from about 18 in
2018, rose to more than 27 in 2019 and then significantly jumped by 92% to 53 in
2020. Total Assets Turnover for Sanna Khanh Hoa went down from 2,33 in 2018 to
1,39 in 2020. The overall rate was higher than that of CDBECO so it can be said that
with this scale of company, Sanna Khanh Hoa had some advantage in managing its
assets during the period.
d) Profitability ratio
Table d
CDBECO
Profitability ratios
16
Year
PM
Annual
percentage
change
ROA
Annual
percentage
change
ROE
Annual
percentage
change
2020
2,11%
-66,01%
0,84%
-87,51%
1,77%
-78,99%
2019
6,21%
229,66%
6,70%
201,64%
8,43%
204,72%
2018
1,88%
-302,85%
2,22%
-275,51%
2,77%
-269,07%
2017
-0,93%
-1,27%
-1,64%
Table d’
SKN
Profitability ratios
Year
PM
Annual
percentage
change
ROA
Annual
percentage
change
ROE
Annual
percentage
change
2020
0,47%
-37,02%
0,65%
-58,47%
0,77%
-60,18%
2019
0,74%
-67,83%
1,56%
-70,98%
1,94%
-72,36%
2018
2,31%
-
5,39%
-
7,03%
-
● CDBECO
Profit Margin (PM), Return on Equity (ROE), and Return on Assets (ROA) of
CDBECO and its competitor will be examined in this part. Thanks to the Dupont
Identity, it is known that these indexes are closely related. An increase in PM leads to
the increase of ROE, for example.
In 2017, CDBECO’s PM was -0.93%, meaning that , from an accounting
perspective, the company lost 0.93 VND for every 100 VND in sales. However, it
witnessed an over 300% and 229% positive rise in PM consecutively during 2018 and
2019. In the year 2020, the figure dropped by two-thirds to 2,11%. ROE and ROA
followed a similar pattern (as seen in table). ROE is a more preferred measure of
performance to shareholders as benefiting shareholders is the main goal of business.
17
In CDBECO’s case ROE was always slightly higher than ROA due to the company’s
use of financial leverage.
● Sanna Khanh Hoa
Indexes for Sanna Khanh Hoa were more positive than CDBECO during 2018,
but became much lower over the next two years.
At the end of 2019, CDBECO witnessed a big rise in PM, ROE, and ROA with
all rising by more than 2 times that of the previous year; while Sanna Khanh Hoa saw
a sharp decline by around 70% for the 3 indexes. After that it continued to drop in
2020, but this time with a slightly lower rate of change.
Both companies experienced significant loss in profit and efficiency in 2020.
However, CDBECO witnessed a much more severe fluctuation than Sanna Khanh
Hoa.
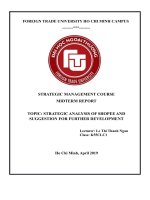
e) Market value ratio
A company’s EPS is one of the most important tools used to evaluate the
business and make investment decisions because it indicates the profitability of a
company. It seems not meaningful when comparing EPS across companies because
the number of shares outstanding for each company is different. However, EPS figures
can be used to compare one company’s performance over time.
According to the financial reports, EPS of both Chuong Duong and Sanna
Khanh Hoa tend to increase, but due to the negative impact of Covid-19, they declined
in 2020. We can see the EPS of CD is overall much higher than that of SKN, except
for in 2020 when they seem to converge. Specifically,
● Chuong Duong: There was a 2.5 times increase in EPS in 2019 to 1,761 VND,
and in 2020, it decreased by 77,06%, back to 404 VND/share.
● Sanna Khanh Hoa: In 2019, EPS increased slightly by 8,73% from 584 in 2018
to 635 VND/share. However, that number dropped 37,32% to 398 VND/share
in 2020.
PART IV: CONCLUSION
IN EACH OF ASPECTS
1. Liquidity
Accounting liquidity measures the ease with which a company can meet their
financial obligations with the liquid assets available to them—the ability to pay off
debts as they come due. In CDBECO’s situation, it has a too high current ratio, current
assets are much higher than the current liabilities, which means CDBECO is unable to
18
use its current assets effectively. Besides that, there are not many companies that have
enough cash and equivalents to cover most of the short-term liabilities, CDBECO still
has a good handling of short-term liabilities because the cash ratios are around 1 over
the years.
In comparison with SKH, CDBECO has higher abilities to deal with short-term
liabilities but has less stability in growth. With the aim of improving liquidity,
CDBECO should balance operating costs, sell unneeded assets, monitor revenue and
expenditure, and monitor profits regularly. It is necessary for CDBECO to make a
suitable proposal to stabilize the development situation for the company.
2. Long-term solvency ratio
From a pure risk perspective, CDBECO seems to have a better debt ratio from
2017 to 2019 because the lower the ratio, the lower chance of having too much debt
which can affect the entire operation if cash flow dries up. In 2020, CDBECO had a
record increase in debt ratio, which means borrowing is becoming increasingly
difficult, which also indicates that CDBECO may be putting itself at risk of default on
its loans if interest rates were to rise suddenly. The higher the debt ratio, the more
leveraged a company is. Therefore, CDBECO should increase the company's
profitability, improve inventory management and restructure debt (when current
market rates are low) to reduce the debt ratio, reduce financial leverage and financial
risk for the company.
3. Efficiency ratio
In comparison with SHK, CDBECO has a reasonable DSI, which shows that it
is more efficient and regularly sells out of inventory, which means fast turnover leads
to higher profit potential from 2017 to 2019. Coupling with DSI's explosive growth in
2020, suggests the company may be struggling with large, high-volume inventories.
Seeing that these problems may be the result of inventory management and poor sales
performance, it’s reasonable for CDBECO to use inventory management including:
inventory timeline, forecast modeling, various reporting,.. to improve these problems.
4. Profitability ratio
Based on the analysis, the PM of CDBECO and SHK is low, but the fluctuation
of CDBECO is higher, because the PM of CDBECO increased rapidly from 2017 to
2019, but there was a sudden decrease in 2020. ROA and ROE are not positive,
showing that in 2020 CDBECO uses assets and capital inefficiently, leading to
investors’ undervaluing shares. In that situation, CDBECO should make a general
plan to improve profit margin, which can also help improve ROA and ROE, for
19
example: improve inventory visibility, streamline operations and reduce operating
expenses, identify and eliminate waste,…
5. Market value ratio
In the market, EPS of CDBECO and SHK significantly reduced because of the
impact of covid-19, in which, the EPS reduction rate of CDBECO was much higher
than that of SHK. Because CDBECO is not really a prominent business compared to
its competitors, there are no preferential policies and rewards for investors, as well as
a small market share, gradually going backward, causing significant impacts. In this
case, CDBECO should conduct regular market research to meet consumers’ taste,
review the company’s market position, and form strategies that are suitable for the
current market situation.
IN GENERAL
Chuong Duong is battling with obsolete technology from the 2000s, so it has
not satisfied the market need for new products matching consumer tastes. In 2016, the
COGS and product costs increased, making it difficult to compete with similar
product lines in the market. In addition, Chuong Duong’s strategy has many problems,
the company continuously lost market share and distribution channels to competitors.
Besides that, Chuong Duong Beverage’s current assets, current liabilities and
total equity all decreased after the Covid-19 shock. Subsequently, the organization's
liquidity, as estimated by current assets contrasted with current liabilities, diminished
over the year.
In addition, it is necessary for Chuong Duong to balance and improve each
problem showed in each aspects, plan to reposition the company's organizational
structure, find out suitable goals in the future based on analysis, research on current
market, improve product quality, production machinery, plan strategy product
promotion suitable for the target customers.
20
PART V: REFERENCES
● SCD: CTCP Nước giải khát Chương Dương - CDBECO | VietstockFinance.
VietstockFinance. (2021). Retrieved 25 September 2021, from
/>y.htm.
● Công Ty Cổ Phần Nước Giải Khát Chương Dương. Thongtindoanhnghiep.co.
(2021). Retrieved 25 September 2021, from
/>huong-duong.
● Quang Thắng. Về tay người Thái, “vua sá xị’ Chương Dương lãi gấp 15 lần.
Zingnews.vn. (2019). Retrieved 25 September 2021, from
/>● Hồng Phúc. Đại dịch mang vị đắng cho sá xị Chương Dương khiến lãi quý I
giảm gần 90%. baodautu. (2020). Retrieved 26 September 2021, from
/>● Hồng Phúc. Chủ tịch sá xị Chương Dương mong cổ đơng kiên nhẫn, chờ ngày
quay lại thời huy hồng. baodautu. (2020). Retrieved 26 September 2021, from
/>o-ngay-quay-lai-thoi-huy-hoang-d124663.html.
● Sá xị Chương Dương (SCD): Lợi nhuận 2020 lao dốc, thù lao, lương thưởng
của nhiều lãnh đạo vẫn tăng. Tin nhanh chứng khoán. (2021). Retrieved 26
September 2021, from
/>c-thu-lao-luong-thuong-cua-nhieu-lanh-dao-van-tang-post267375.html.
● Sá xị Chương Dương đầu tư 80 tỉ đồng xây dựng nhà máy mới. Báo Đồng Nai.
(2019). Retrieved 27 September 2021, from
/>0-ti-dong-xay-dung-nha-may-moi-2977290/index.htm.
● Hòa My. Nước giải khát Chương Dương không muốn quá lệ thuộc vào sá xị.
vietnambiz. (2020). Retrieved 27 September 2021 2021, from
/>
21