Development of an effusive molecular beam apparatus
Bạn đang xem bản rút gọn của tài liệu. Xem và tải ngay bản đầy đủ của tài liệu tại đây (5.9 MB, 118 trang )
Daniel Halwidl
Development of an
Effusive Molecular
Beam Apparatus
BestMasters
www.pdfgrip.com
Springer awards „BestMasters“ to the best master’s theses which have been com
pleted at renowned universities in Germany, Austria, and Switzerland.
The studies received highest marks and were recommended for publication by
supervisors. They address current issues from various fields of research in natural
sciences, psychology, technology, and economics.
The series addresses practitioners as well as scientists and, in particular, offers guid
ance for early stage researchers.
www.pdfgrip.com
Daniel Halwidl
Development of an
Effusive Molecular
Beam Apparatus
www.pdfgrip.com
Daniel Halwidl
Wien, Österreich
BestMasters
ISBN 978-3-658-13535-5
ISBN 978-3-658-13536-2 (eBook)
DOI 10.1007/978-3-658-13536-2
Library of Congress Control Number: 2016935968
Springer Spektrum
© Springer Fachmedien Wiesbaden 2016
This work is subject to copyright. All rights are reserved by the Publisher, whether the whole or part
of the material is concerned, specifically the rights of translation, reprinting, reuse of illustrations,
recitation, broadcasting, reproduction on microfilms or in any other physical way, and transmission
or information storage and retrieval, electronic adaptation, computer software, or by similar or
dissimilar methodology now known or hereafter developed.
The use of general descriptive names, registered names, trademarks, service marks, etc. in this
publication does not imply, even in the absence of a specific statement, that such names are exempt
from the relevant protective laws and regulations and therefore free for general use.
The publisher, the authors and the editors are safe to assume that the advice and information in this
book are believed to be true and accurate at the date of publication. Neither the publisher nor the
authors or the editors give a warranty, express or implied, with respect to the material contained
herein or for any errors or omissions that may have been made.
Printed on acid-free paper
Springer Spektrum imprint is published by Springer Nature
The registered company is Springer Fachmedien Wiesbaden GmbH
www.pdfgrip.com
Acknowledgements
I would like to express my gratitude and appreciation to my supervisors Prof. Ulrike Diebold and Jiri Pavelec, who supported me during my diploma thesis. I want
to especially thank Jiri Pavelec for the technical drawings and encouraging me in
my work. I also feel grateful to Prof. Michael Schmid, who was always available
for fruitful discussions.
I want to thank Herbert Schmidt and Rainer Gärtner, who showed great skills and
patience when it came to the production of the many parts the Molecular Beam
consists of.
Many thanks I want to adress to Jan Hulva, Manfred Bickel, Florian Brunbauer
and Jakub Piastek for their support in the laboratory.
Finally, I want to thank my family for supporting me during my study.
Daniel Halwidl
www.pdfgrip.com
Abstract
This thesis describes the development of an effusive molecular beam apparatus,
which allows the dosing of gases, liquids and solids. The apparatus was designed
to adsorb precise and reproducible doses to a defined area on metal oxide samples,
which is required in Thermal Programmed Desorption and other surface chemistry
experiments in the “Machine for Reactivity Studies”. The theoretical profile of the
molecular beam has a core diameter of 3.5 mm and a standard core pressure of
4 10−8 mbar, while the background pressure of the beam is 4 orders of magnitude lower. The design and the construction of the apparatus is described. The
calculated beam profile was experimentally confirmed and core pressures between
1.7 10−8 mbar and 2.9 10−6 mbar were measured.
www.pdfgrip.com
Kurzfassung
Diese Diplomarbeit beschreibt die Entwicklung einer effusiven Molekularstrahlapparatur für die Adsorption von Gasen, Flüssigkeiten und Feststoffen auf Metalloxidproben in der “Machine for Reactivity Studies”. Die Adsorption einer präzisen, reproduzierbaren Dosis auf einem wohldefinierten Bereich der Probenoberfläche ist für Thermische Desorptionsspektroskopie und andere Methoden der Oberflächenchemie notwendig. Das berechnete Profil des Molekularstrahls weist einen
Kern mit Durchmesser 3.5 mm und einen Standarddruck von 4 10−8 mbar auf,
während der Hintergrunddruck des Molekularstrahls um 4 Grưßenordnungen kleiner ist. Der Entwurf und die Konstruktion des Apparats sind beschrieben. Das berechnete Profil wurde experimentell bestätigt und ein Druck von 1.7 10−8 mbar
bis 2.9 10−6 mbar im Kern des Molekularstrahls gemessen.
www.pdfgrip.com
Contents
Acknowledgements
V
Abstract
VII
Kurzfassung
IX
List of Figures
XIII
List of Tables
XVII
1
Introduction
1.1 Molecular Beams . . . . . . . . . . . . . . . . . . . . . . . . . .
1.2 Temperature Programmed Desorption . . . . . . . . . . . . . . .
2
Flow of Gases
2.1 Flow Regimes . . . . . . .
2.2 Conductance . . . . . . .
2.2.1 Molecular flow . .
2.2.2 Continuum flow .
2.2.3 Transition flow and
range . . . . . . .
. . . . . . .
. . . . . . .
. . . . . . .
. . . . . . .
conductance
. . . . . . .
. .
. .
. .
. .
the
. .
5
5
6
7
11
. . . . . . . . .
. . . . . . . . .
. . . . . . . . .
. . . . . . . . .
whole pressure
. . . . . . . . .
15
3
Effusive Molecular Beam Sources
3.1 Thin-walled Orifice . . . . . . . . . . . . . . . . . . . . . . . . .
3.2 Single Tube . . . . . . . . . . . . . . . . . . . . . . . . . . . . .
3.3 Capillary Array . . . . . . . . . . . . . . . . . . . . . . . . . . .
19
19
21
22
4
Molecular Beam
4.1 Requirements . . . . . . . . . . . . . . . . . . . . . . . . . . . .
4.2 Concept . . . . . . . . . . . . . . . . . . . . . . . . . . . . . . .
4.3 Theory . . . . . . . . . . . . . . . . . . . . . . . . . . . . . . . .
25
25
27
30
www.pdfgrip.com
. . .
. . .
. . .
. . .
over
. . .
1
2
3
XII
Contents
4.4
5
6
4.3.1 Core and Penumbra . . . . . . . . . . . . . . . .
4.3.2 Equivalent pressure . . . . . . . . . . . . . . . .
4.3.3 Molecular Beam intensities and doses . . . . . .
4.3.4 Geometry . . . . . . . . . . . . . . . . . . . . .
4.3.5 Molecular Beam dimensions . . . . . . . . . . .
4.3.6 Pressures in the pumping stages and the chamber
4.3.7 Effusing gas from the pumping stages . . . . . .
4.3.8 Molecular Beam properties . . . . . . . . . . . .
4.3.9 Capillary pressure . . . . . . . . . . . . . . . .
Construction . . . . . . . . . . . . . . . . . . . . . . . .
4.4.1 Overview . . . . . . . . . . . . . . . . . . . . .
4.4.2 Molecular Beam Core Part . . . . . . . . . . . .
4.4.3 Shutter Motor . . . . . . . . . . . . . . . . . . .
4.4.4 Pumping stages . . . . . . . . . . . . . . . . . .
4.4.5 Reservoir . . . . . . . . . . . . . . . . . . . . .
4.4.6 Pumping speed . . . . . . . . . . . . . . . . . .
4.4.7 Aperture and Shutter conductances . . . . . . .
Results
5.1 Test Setup . . . . . . . . . . . . . . . . . . .
5.1.1 Argon correction factor . . . . . . . .
5.2 Molecular Beam Profile . . . . . . . . . . . .
5.2.1 Molecular Beam line profile . . . . .
5.2.2 Molecular Beam 2D profile . . . . .
5.2.3 Pumping Stage 1 core and penumbra .
5.2.4 Molecular Beam Background . . . .
5.3 Shutter . . . . . . . . . . . . . . . . . . . . .
.
.
.
.
.
.
.
.
.
.
.
.
.
.
.
.
.
.
.
.
.
.
.
.
.
.
.
.
.
.
.
.
.
.
.
.
.
.
.
.
.
.
.
.
.
.
.
.
.
.
.
.
.
.
.
.
.
.
.
.
.
.
.
.
.
.
.
.
.
.
.
.
.
.
.
.
.
.
.
.
.
.
.
.
.
.
.
.
.
.
.
.
.
.
.
.
.
.
.
.
.
.
.
.
.
.
.
.
.
.
.
.
.
.
.
.
.
.
.
.
.
.
.
.
.
.
.
.
.
.
.
.
.
30
34
34
37
42
43
46
47
50
53
53
54
59
62
67
68
72
.
.
.
.
.
.
.
.
.
.
.
.
.
.
.
.
.
.
.
.
.
.
.
.
.
.
.
.
.
.
.
.
.
.
.
.
.
.
.
.
75
75
77
79
79
84
84
85
86
Summary and Outlook
89
A Gas Properties
A.1 Maxwell-Boltzmann Distribution . . . . . . . . . . . . . . . . . .
91
91
B Conductance
B.1 Molecular Flow in an Annular Tube . . . . . . . . . . . . . . . .
B.2 Orifice in Transition Flow . . . . . . . . . . . . . . . . . . . . . .
93
93
99
C Pirani Gauge Argon Correction Factor
101
References
103
www.pdfgrip.com
List of Figures
2.1
2.2
2.3
2.4
2.5
3.1
3.2
3.3
4.1
4.2
4.3
4.4
4.5
4.6
4.7
4.8
4.9
4.10
4.11
4.12
4.13
4.14
Transmission probability for a tube in molecular flow . . . . . . .
Transmission probability for an annular tube in molecular flow . .
Flow function in continuum flow . . . . . . . . . . . . . . . .
Interpolation of experimental values for the orifice conductance . .
Conductance function f and correction factor Z for the conductance of a tube . . . . . . . . . . . . . . . . . . . . . . . . . . . .
Angular dependence of the intensity per unit area from a thinwalled orifice . . . . . . . . . . . . . . . . . . . . . . . . . . . .
Angular intensity distribution of a tube . . . . . . . . . . . . . . .
Intensity distribution of a capillary array on a planar sample . . . .
Ideal intensity distribution of the MB on the sample . . . . . . . .
Schematic of the working principle of the MB . . . . . . . . . . .
Reservoir supply and pumping schematic of the MB . . . . . . . .
Geometry of source, aperture and plane with core and penumbra .
Intensity in the penumbra . . . . . . . . . . . . . . . . . . . . . .
The ratio of approximated to integrated relative penumbra dose . .
Denotation of doses in the different areas of the MB on the sample
Geometry schematic of the MB . . . . . . . . . . . . . . . . . . .
Contour plot of the MB core pressure in dependence of the Orifice
and Aperture 2 distance . . . . . . . . . . . . . . . . . . . . . . .
Intercepted molecular beam areas at the PS2 side of Aperture 2 . .
Capillary pressure as a function of the Reservoir pressure for a
pumping orifice diameter of dPO D 800 μm . . . . . . . . . . . .
Capillary pressure as a function of the Reservoir pressure for a
pumping orifice diameter of dPO D 150 μm . . . . . . . . . . . .
Average time for a water molecule to leave a capillary according
to a random walk model . . . . . . . . . . . . . . . . . . . . . .
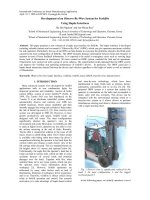
3D model of the Molecular Beam . . . . . . . . . . . . . . . . .
www.pdfgrip.com
9
10
14
16
18
20
22
23
25
27
29
31
33
34
35
39
42
45
51
51
53
55
XIV
4.15
4.16
4.17
4.18
4.19
4.20
4.21
4.22
4.23
4.24
4.25
4.26
4.27
4.28
4.29
4.30
4.31
4.32
4.33
5.1
5.2
5.3
5.4
5.5
5.6
5.7
5.8
List of Figures
MB Core Part . . . . . . . . . . . . . . . . . . . . . . . . . . . .
Orifice Inset without and with laser-welded Orifice . . . . . . . .
SEM images of the Orifices . . . . . . . . . . . . . . . . . . . . .
Aperture 1 and Aperture 2 . . . . . . . . . . . . . . . . . . . . .
Cross section of the MB Core Part with mounted Orifice Inset,
Aperture 1 and Aperture 2 . . . . . . . . . . . . . . . . . . . . .
Shutter Assembly . . . . . . . . . . . . . . . . . . . . . . . . . .
Shutter Assembly mounted on the MB Core Part and Aperture 2
O-ring . . . . . . . . . . . . . . . . . . . . . . . . . . . . . . . .
Coil cores and Motor Lever of the Shutter Motor . . . . . . . . .
Shutter Motor . . . . . . . . . . . . . . . . . . . . . . . . . . . .
PS2 Shell and Rear Ring of the Parallel Shift Cage . . . . . . . .
PS1 . . . . . . . . . . . . . . . . . . . . . . . . . . . . . . . . .
(a) PS1 Front Assembly.
(b) PS1 Front Assembly inserted into the Parallel Shift Cage.
Position adjustment and Pushing Ring . . . . . . . . . . . . . . .
(a) Position adjustment of the MB
(b) Pushing Ring at the back of the PS1 Back Tube
PS1 Rear Assembly . . . . . . . . . . . . . . . . . . . . . . . . .
MB Tee and PS1 Feedthrough Reducer . . . . . . . . . . . . . . .
D-sub connection and D-sub feedthrough . . . . . . . . . . . . .
(a) D-sub connection and CF 40 6-way cross
(b) Layout of the atmosphere side of the D-sub feedthrough
Reservoir Tube . . . . . . . . . . . . . . . . . . . . . . . . . . .
View inside the PS1 Back Tube towards the MB Core Part . . . .
Reservoir connection at the backside of the MB Cross . . . . . . .
Cross section of the MB Core Part with Aperture details . . . . .
56
57
57
58
Schematic of the test setup . . . . . . . . . . . .
Photograph of the test setup . . . . . . . . . . . .
(a) Overview
(b) Equipment connected to the Reservoir
Line profile of the MB for pr D 4:1 10 1 mbar
Detailed line profile of the rising edge of the MB
Line profile of the MB for pPir D 10 mbar . . . .
2D profile of the MB . . . . . . . . . . . . . . .
Line profile of the PS1 core and penumbra . . . .
Line profile of the MB Background . . . . . . . .
. . . . . . . . .
. . . . . . . . .
77
78
.
.
.
.
.
.
80
81
82
85
86
87
www.pdfgrip.com
.
.
.
.
.
.
.
.
.
.
.
.
.
.
.
.
.
.
.
.
.
.
.
.
.
.
.
.
.
.
.
.
.
.
.
.
.
.
.
.
.
.
.
.
.
.
.
.
58
59
60
61
61
62
64
65
65
66
67
68
69
69
71
List of Figures
XV
B.1 Correction factor, K0 , for Knudsen’s formula for the conductance
of an annular tube . . . . . . . . . . . . . . . . . . . . . . . . . .
B.2 Comparison of the various formulas for the conductance of annular
tubes with Di =Do D 0:2 . . . . . . . . . . . . . . . . . . . . . .
B.3 Comparison of the various formulas for the conductance of annular
tubes with Di =Do D 0:8 . . . . . . . . . . . . . . . . . . . . . .
94
97
98
C.1 Pressure reading of the spinning rotor gauge as a function of the
Pirani gauge reading . . . . . . . . . . . . . . . . . . . . . . . . 102
www.pdfgrip.com
List of Tables
2.1
2.2
4.1
4.2
4.3
4.4
4.5
4.6
4.7
4.8
4.9
5.1
5.2
5.3
Molecular orifice conductance per area for gases . . . . . . . . . .
Isentropic exponent, critical pressure ratio, and maximum value of
the flow function for various gas species . . . . . . . . . . . . . .
Notation used in the geometry schematic (Fig. 4.8) and the calculation . . . . . . . . . . . . . . . . . . . . . . . . . . . . . . . .
Dimensions of the MB . . . . . . . . . . . . . . . . . . . . . . .
Relative doses of the MB and the relative MB background pressure
MB properties for the standard Reservoir pressure . . . . . . . . .
MB properties for pr D 54:0 mbar . . . . . . . . . . . . . . . . .
Components of the approximated tubing from the volume behind
Aperture 1 to the PS1 TMP . . . . . . . . . . . . . . . . . . . . .
Components of the approximated tubing from the volume behind
Aperture 2 to the PS2 TMP . . . . . . . . . . . . . . . . . . . . .
Components of the model for the Aperture 1 conductance . . . . .
Components of the model for the Aperture 2 conductance . . . . .
Theoretical and experimental MB properties for standard Reservoir pressure . . . . . . . . . . . . . . . . . . . . . . . . . . . . .
Theoretical and experimental MB properties for a Reservoir pressure of pPir D 10 mbar . . . . . . . . . . . . . . . . . . . . . . .
Pressure in PS2 in dependence of the set pressure in PS1 and the
shutter position . . . . . . . . . . . . . . . . . . . . . . . . . . .
A.1 Standard atomic weight, viscosity and average particle velocity of
gases . . . . . . . . . . . . . . . . . . . . . . . . . . . . . . . . .
B.1 Correction factor, K0 , for Knudsen’s formula for the conductance
of an annular tube . . . . . . . . . . . . . . . . . . . . . . . . . .
B.2 Transmission probability values for an annular tube, read off [13,
Fig. 4.39] . . . . . . . . . . . . . . . . . . . . . . . . . . . . . .
www.pdfgrip.com
8
12
38
44
48
49
49
70
72
72
73
81
84
88
91
94
95
XVIII
List of Tables
B.3 Experimental values for the orifice conductance, read off [12, Fig.2] 99
C.1 Measured SRG and Pirani gauge pressures for Ar . . . . . . . . . 101
www.pdfgrip.com
1 Introduction
The “Machine for Reactivity Studies” (MRS) is a recently built vacuum chamber that will provide analysis techniques (Low Energy Electron Diffraction, Low
Energy Ion Scattering, Temperature Programmed Desorption (TPD), Ultraviolet
Photoelectron Spectroscopy, X-ray Photoelectron Spectroscopy) to investigate adsorption and surface chemistry at oxide surfaces. For cooling the sample a continuous-flow liquid He cryostat is used, which allows base sample temperatures
below 50 K. Heating the sample to up to 1200 K is done by resistive heating of the
sample holder.
Temperature Programmed Desorption (see Section 1.2) and other surface chemistry experiments require the adsorption of gases, evaporated liquids or sublimated
solids on the sample. When desorbing the adsorbates again, usually only particles
that desorb from the sample surface are of interest. One possibility is to dose to all
surfaces in the camber and then come very close to the sample surface with a differentially pumped detector, where the entrance to the detector is a small aperture,
only sampling species from the sample surface [9, 18]. That works fine for metal
samples, which are directly spot-welded to thin heating wires, where the area of
the heating wires is small compared to the sample area. Metal oxide samples that
are used in the MRS can not be spot-welded but have to be clamped by a retaining frame. Since the frame is so close to the sample, the desorbing species would
affect the TPD results. Therefore the adsorption has to be limited to the sample
surface in the first place, which is achieved by the use of a molecular beam.
© Springer Fachmedien Wiesbaden 2016
D. Halwidl, Development of an Effusive Molecular Beam Apparatus,
www.pdfgrip.com
BestMasters, DOI 10.1007/978-3-658-13536-2_1
2
1 Introduction
1.1 Molecular beams
A molecular beam (MB) is defined as a collision-free, spatially well-defined and
directed flow of molecules [15]. To create a MB, gas with a certain temperature and
pressure is expanded from a reservoir through a source nozzle into an evacuated
chamber. The properties of the MB depend on the detailed form and size of the
nozzle and the pressure and temperature of the gas in the reservoir. Once the
initial MB has been created, it can be influenced further, for example by skimmers,
apertures, shutters, and velocity selectors before hitting the sample.
Effusive and supersonic MBs are distinguished depending on the Knudsen number describing the expansion through the source nozzle. In supersonic beams the
Knudsen number (see Section 2.1) is small: a gas with relatively high pressure
(several atm.) reaches the speed of sound at the nozzle, and supersonic velocities
in the following free jet expansion. Due to the frequent collisions during expansion
the velocity distribution of the gas molecules is narrowed until, at certain distance
from the source, the pressure in the beam drops to molecular flow conditions. In
the sudden freeze model the surface at that distance is named the quitting surface,
which then can be described as an effusive source. Therefore the effective radiating area can be larger than the geometrical area of the nozzle [3, 21]. The main
advantages of a supersonic beam source are a narrow velocity distribution, variable kinetic energy, and a large degree of control over the internal energy. These
features are essential in studies of the gas-surface dynamics, of surface scattering
and diffraction or of fast transient kinetics [15].
In an effusive molecular beam, as in the present work, the Knudsen number in the
source nozzle is large: the mean free path in the source is large compared to the
size of the nozzle and particles don not collide with each other as the gas expands.
Thus, the flow rate as well as the angular and velocity distribution of the effusing
particles can be calculated exactly by gas kinetics [21]. If the thermal equilibrium
in the source is not disturbed by the opening in the wall of the source, the beam
contains a well defined equilibrium distribution of internal states and the same
dimer fraction as that of the gas within the source. Sources for effusive molecular
www.pdfgrip.com
1.2. Temperature Programmed Desorption
3
beams include thin-walled orifices, single tubes and capillary arrays. An effusive
molecular beam apparatus using a capillary array as source is described by Libuda
et al. [16].
1.2 Temperature programmed desorption
The desorption of adsorbed atoms or molecules can provide information concerning the strength of interactions between the surface and the adsorbed species [1].
In TPD a temperature ramp, linear in time, is applied to the sample and the rate of
adsorbates desorbing into the gas phase is monitored by a detector. For preparing
the adsorbate, the sample has to be sufficiently cold to adsorb molecules or atoms
that impinge on the sample surface.
Desorption is an activated process with a rate constant kd that obeys an Arrhenius
dependence
Ã
Â
Ed
kd D A exp
;
(1.1)
RT
where Ed is the activation energy for desorption and A is a pre-exponential factor [1]. A has the unit s−1 and can be seen as an attempt frequency; for first order
desorption (see below) A is of the same order of magnitude as the molecular vibrational frequency and usually assumed to be 1013 s−1 . With increasing temperature,
thermal energy becomes sufficient to break surface bonds and desorption is observed. The rate of desorption may be formulated as
kd
A
dN
D N m D N m exp
dT
ˇ
ˇ
Â
Ed
RT
Ã
;
(1.2)
where N is the number of adsorbed molecules, ˇ is the heating rate, and m is
the order of the desorption. Although kd increases exponentially with temperature, a maximum of the desorption rate is observed, because the surface coverage
decreases during the desorption process.
Multilayer systems exhibit zero-order desorption where the rate of desorption does
www.pdfgrip.com
4
1 Introduction
not depend on N . Here the rate of desorption increases exponentially with temperature and goes to zero when all adsorbates have been desorbed. With increasing
initial coverage the multilayer desorption peak will grow in intensity and its maximum will shift to higher temperatures. The temperature of the leading edge of
the desorption peak is independent of the initial coverage and depends only on the
adsorbate; the influence of the surface is almost completely screened. The bonds
in the second and subsequent monolayers are usually weaker than the bond of the
first monolayer to the substrate, therefore multilayer desorption peaks appear at
lower temperatures relative to the desorption peaks from the first monolayer.
Desorption from monolayer or submonolayer coverages is in the simplest case
of first order. The rate of desorption increases exponentially with temperature,
reaches a maximum and decreases as the number of possible desorption sites (the
adsorbed molecules) decreases. With increasing initial coverages the symmetric
desorption peak grows in intensity and its maximum should stay at the same temperature. However, in practice it is often observed that the maximum shifts to
lower or higher temperature with increasing initial coverage as lateral interactions
between the molecules influence the activation energy for desorption.
www.pdfgrip.com
2 Flow of gases
When planning a molecular beam apparatus the knowledge of the different flow
regimes is important . These play a key role in the formation of molecular beams
and in the design of conductance requirements in the whole vacuum system.
2.1 Flow regimes
The mean free path, , is defined as the average distance a particle in a gas travels
before colliding with another particle. A way to obtain the mean free path is to
calculate it via the viscosity, Á, as [24, p.664]
p
Á
D
2 p
r
Á
2kB T
D
vN ;
m
4 p
(2.1)
where vN is the average velocity of the gas particles, given by
r
vN D
8kB T
:
m
(2.2)
Three idealized regimes are distinguished depending on the pressure and the geometry of the vacuum equipment the gas is flowing through (e.g. the diameter of
a tube or orifice, the length of a channel) : molecular flow, continuum flow and
transition flow [20, pp.25–27].
If the pressure is sufficiently low, the mean free path of the particles will be much
greater than the diameter of the vacuum equipment. Therefore the majority of particles will move along straight trajectories until hitting a wall. Collisions between
© Springer Fachmedien Wiesbaden 2016
D. Halwidl, Development of an Effusive Molecular Beam Apparatus,
www.pdfgrip.com
BestMasters, DOI 10.1007/978-3-658-13536-2_2
6
2 Flow of Gases
the particles occur very rarely, they move independently of each other. These conditions are called molecular flow. The flow is only caused by the kinetic energy of
the particles.
If the pressure is sufficiently high, the mean free path of the particles is much
smaller than the diameter or length of the vacuum equipment. Therefore particles
will collide very often with each other, resulting in frequent exchange of momentum and energy. The particles can be treated as a continuum and flow is caused by
local pressure gradients. Thus, this regime is named continuum flow. Continuum
flow can be either turbulent or laminar viscous.
Transition flow occurs when the pressure is between the limits above; neither
molecular or continuum flow prevails.
To quantitatively distinguish the flow regimes the dimensionless Knudsen number, Kn, is defined as
Kn D
D
;
(2.3)
where is the mean free path and D is the characteristic dimension of the vacuum equipment (e.g. diameter of a tube). The transition between flow regimes is
continuous, but a classification by the Knudsen number is:
Kn > 1 molecular flow,
1 > Kn > 0:01 transition flow,
(2.4)
Kn < 0:01 continuum flow.
2.2 Conductance
In the following sections the conductance in the different flow regimes is discussed.
The conductance, C , of a tubing component is generally defined as [13, p.92]
C D
qpV
;
p1 p2
ŒC D m3 =s ;
www.pdfgrip.com
(2.5)
2.2. Conductance
7
where qpV is the throughput and p1 p2 is the pressure difference between the
entrance and the exit of the tubing component.
2.2.1 Molecular flow
Particles that enter a tube will move on a straight trajectory until they hit either
the wall of the tube or make it directly to the exit of the tube. Particles that have
collided with the wall will be scattered in random directions and thus go back and
forth in the tube until they leave the tube either through the entrance or the exit area.
Therefore the conductance in molecular flow, Cmol , can be described statistically
by the conductance of the entrance area, CO , and the transmission probability, P ,
for a particle to make it through the tubing component [13, pp.135–139]:
Cmol D CO P :
(2.6)
Orifice
The conductance, CO , of an ideal orifice with infinitely small wall thickness (L D
0) and area A is
CO D
vN
A:
4
(2.7)
The transmission probability of an ideal orifice (L D 0) is obviously 1. Table 2.1 shows the orifice conductance per area, CO =A, for different gases according
to Eq. (2.7).
Tube
The transmission probability, PT , for a tube with length L and diameter D is given
by [13, pp.142–144]
PT .L; D/ D
L
14 C 4 D
L
14 C 18 D
C3
www.pdfgrip.com
L 2
D
:
(2.8)
8
2 Flow of Gases
Gas
vN [m/s]
CO =A [l/(s cm2 )]
H2
He
H2 O
N2
Ar
Xe
1762
1246
587
471
394
218
44.0
31.1
14.7
11.8
9.8
5.4
Table 2.1: Molecular orifice conductance per area for gases at 20 ıC .
For a short tube with L << D the transmission probability PT becomes
PT,short D 1
L
;
D
(2.9)
and for a long tube with L >> D
PT,long D
4D
:
3L
(2.10)
Figure 2.1 shows the transmission probability, PT , according to Eq. (2.8). The
conductance of a tube, CT , is then given by Eq. (2.6).
CT D CO,T PT ;
(2.11)
where CO,T is the orifice conductance of the entrance area of the tube.
Tube with annular cross section
Several formulas for the conductance of a tube with an annular (ring-like) cross
section can be found in the literature, see Appendix B.1, Page 93. The formula,
which will be used in this work to calculate the conductance, Cann , of an annular
tube (important for the pumping speeds in the pumping stages of the MB, see
Section 4.4.6, Page 68) with outer diameter Do , inner diameter Di and length L is
www.pdfgrip.com
2.2. Conductance
9
Figure 2.1: Transmission probability, PT , for a tube as a function of the relative length, L=D,
according to Eq. (2.8).
given by
r
Cann D 3:81
T .Do Di /2 .Do C Di /
;
M L C 1:33.Do Di /
(2.12)
where M is the relative molecular mass; dimensions are in cm and Cann in l/s.
Figure 2.2 shows the transmission probability, Pann , obtained from Eq. (2.12).
Tubing components in series
The simplest way to calculate the conductance of composite systems is the electric
circuit analogy [13, pp.91–94]. If n elements are connected parallel, the conductances, Ci , add up to give
C D C1 C C2 C ::: C Cn :
(2.13)
and if connected in series, the inverse conductances add up to give
1
1
1
1
D
C
C ::: C
:
C
C1
C2
Cn
www.pdfgrip.com
(2.14)
10
2 Flow of Gases
Figure 2.2: Transmission probability for annular tubes, Pann , with different inner to outer diameter
ratio, Di =Do , as a function of the relative length, L=Do , obtained from Eq. (2.12). The transmission probability was obtained by dividing the conductance, Cann , by the orifice conductance of the
annular cross section.
The latter case also applies to the calculation of the effective pumping speed at a
certain point in a vacuum system. It is given by the pumping speed, Sp , provided
by the vacuum pump and the conductance, C , of the tubing connecting said point
to the pump. The effective pumping speed, Seff , is then given by
1
1
1
D
C :
Seff
Sp
C
(2.15)
However, two conditions must be met for the circuit analogy to hold: the rate
of flow of gas through a single tube must be proportional to the pressure difference between its ends, and the conductivity of a tube must be independent of the
components to which its ends are connected. The latter is in general not true,
as Eq. (2.14) gives a rather poor approximation with errors up to 40 % for two
tubes with identical radii connected in series [19]. A better expression for the
www.pdfgrip.com