Brian H. Kaye - Characterization of Powders and Aerosols-Wiley-VCH (1999)
Bạn đang xem bản rút gọn của tài liệu. Xem và tải ngay bản đầy đủ của tài liệu tại đây (15.48 MB, 314 trang )
Brian H. Kaye
Characterization of
Powders and Aerosols
@ WILEY-VCH
www.pdfgrip.com
Brian H. Kaye
Characterization of
Powders and Aerosols
@ WILEY-VCH
Weinheim . New York . Chichester . Brisbane . Singapore . Toronto
www.pdfgrip.com
Professor Emeritus Brian H. Kaye
Laurentian University
Ramsey Lake Road
Sudbury, Ontario P3E 2C6
Canada
This book was carefully produced. Nevertheless, author and publisher do not warrant the information
contained therein to be free of errors. Readers are advised to keep in mind that statements, data,
illustrations, procedural details or other items may inadvertently be inaccurate.
Library of Congress Card No. applied for
A catalogue record for this book is available from the British Library
Die Deutsche Bibliothek - Cataloguing-in-Publication Data
Kaye, Brian H.:
Characterization of powder and aerosols / Brian H. Kaye. - 1. Aufl. - Weinheim ;
New York ; Chichester ; Brisbane ; Singapore ;Toronto : Wiley-VCH, 1999
ISBN 3-527-28853-8
0 WILEY-VCH Verlag GmbH, D-69469 Weinheim (Federal Republic of Germany), 1999
Printed on acid-free and chlorine-free paper
All rights reserved (including those of translation into other languages). No part of this book may be
reproduced in any form - b y photoprinting, microfilm, or any other means -nor transmitted or translated
into a machine language without written permission from the publishers. Registered names, trademarks, etc.
used in this hook, even when not specifically marked as such, are not to be considered unprotected by law.
Composition: Text- und Software-Service Manuela Treindl, D-93059 Regensburg
Printing: strauss offsetdruck, D-69509 Morlenbach
Bookbinding: Wilhelm Osswald + Co., D-67433 Neustadt
Printed in the Federal Republic of Germany
www.pdfgrip.com
Preface
I first started working with powders in 1955. In the 43 years since that initial activity there has been a multitude of developments of instruments and sources of information on the performance of these instruments. Back in 1955 the Coulter Counter
was becoming well known and the height of sophistication was the Photosedimendometer. I began my studies using an Andreason bottle and moved on to study the possibility of using divers and developed all the way to fractals. In the period covered by
my activities in particle size analysis the type of book required for people active in the
field has changed. When I began my work there was no journal devoted to the subject
but as of now we have three journals, Aerosol Science, Particle and Particle Systems
Characterization and Particle Technology. I was involved in setting up of both of these
latter journals and they have both grown into many volumes. Also in the early days
there was difficulty in finding information on the performance of instruments whereas
today many manufactures provide comprehensive notes on operational variables with
their machines. The availability of the journal information and literature from manufacturers means that the role of potential textbooks has changed. In this book we have
tried to set out the basic methods for characterizing powders and aerosols and have
tried to indicate the questions that the investigator should use when trying to choose
a method for his particular needs. The inter-method comparison of data generated in
particle size is still a complex problem and one of the useful features of this book is
the provision of many graphs showing the relative performance of different machines
in assessing powder properties.
The question of particle shape is a complex problem and we are still at the stage
where we are developing methods to see ifwe can characterize adequately the range of
shapes within a powder and their effect on the powder system and/or the aerosol system. It is becoming apparent that some complex problems will require more than one
method of characterization thus if one was inhaling a complex soot particle the aerodynamic diameter which governs the penetration of the lung is one parameter whereas
the fractal structure is another needed to assess the potential health hazard of the inhaled aerosol particle.
A problem facing the investigator in powder technology is that many of the earlier
publications use methodologies to characterize the powders that are no longer avail-
www.pdfgrip.com
VI
Preface
able. To enable the analyst to assess the information presented in earlier publications
we have reviewed the physical principles and have set out the problems associated with
some of the classical instruments such as the micromerograph which for many years
was a standard method in the powder metallurgy industry but is now only of historic
interest. Sometimes the problems associated with methods are posed by the cessation
of manufacturing of a given procedure. Thus the M.S.A. Centrifuge method was very
widely used in occupational health and safety but the manufactures decided to discontinue the manufacturing of equipment so for continuity of interpretation the
method has been outlined. Emphasis has been placed on references to enable the reader
to recover detailed information for their own investigations. Unfortunately normal
systems of training in industry such as pharmaceuticals, chemical engineering, and
powder metallurgy do not present a great deal of information on characterization procedures and because methods have developed in different subjects different scientists
tend to use different words for the same concept. Therefore we have attempted to clarify
some of the vocabulary which has been used in different fields of endeavor which generate information of interest to a wider audience of scientists than those who have immediately carried out the work.
Any author has his own biases when writing a book and since we have been very
active at Laurentian University in developing shape methodologiesthis aspect of powder
technology has been fully covered in this text.
Hopefully the advanced reader will find references to work relevant to their own
studies and student reader will find this book a useful introduction to methods for
characterizing powders and aerosols.
www.pdfgrip.com
Acknowledgments
Many students have contributed to the development of this book and the typing
of the script. I thank then the following people who have been particularly active: Cherie
Turbitt Daoust, Lorna Mac Lod, Heather Eberhardt and my two daughters Sharon
Kaye and Alison Kaye have also contributed to the text preparation. Cherie undertook the difficult task of copyright clearance and the help of Garry Clark in preparing
the diagrams and in general proof reading the scripts have been invaluable. I also wish
to thank the manufactures of the various machines who have been most helpful in
providing data and material describing their instruments. In particular Morris Wed
of Malvern Instruments was most helpful in supplying of literature on diffractometers.
I also wish to thank the personal at Wiley-VCH especially Barbara Bock, for encouraging me to finish this project.
Laurentian University
B. H. Kaye
www.pdfgrip.com
Table of Contents
1
Basic Concepts in Characterization Studies. Representative Samples
and Calibration Standards ............................................................................
1.1
1.2
1.3
1.4
1.5
1.6
2
1
1
Who Needs to Characterize Powders and Spray Systems? .......................
2
The Physical Significance of Size Measurements .....................................
Standard Powders for Calibrating Powder Measurement Techniques ...... 7
Representative Samples ........................................................................... 7
Representative Samples from Suspensions and Aerosol Clouds ............. 13
Dispersing Powder Samples for Size Characterization Studies ............... 17
Direct Measurement of Larger Fineparticles and the Use of Image
Analysis Systems to Characterize Finepartides ...........................................
21
2.1 Measurements on Larger Fineparticles ..................................................
21
2.2 Measuring the Shape Distribution of Fineparticles Using the Concept
23
of Chunkiness ......................................................................................
2.3 Characterizing the Presence of Edges O n a Fineparticle Profile ............. 32
2.4 Geometric Signature Waveforms for Describing the Shape of Fineparticles ................................................................................................ 35
2.5 Using Automated Image Analysis Systems to Size Fineparticle
Populations ..........................................................................................
38
2.6 Fractal Characterization of Rugged Boundaries ....................................
46
2.7 Stratified Count Logic for Assessing an Array of Fineparticle Profiles ... 53
2.8 Special Imaging Procedures for Studying Fineparticles ..........................
54
3
Characterizing Powders Using Sieves .........................................................
3.1
3.2
3.3
3.4
Sieving Surfaces ....................................................................................
The Rate of Powder Passage Through a Sieve .......................................
Sieving Machines ..................................................................................
Possible Future Developments in Sieving ..............................................
www.pdfgrip.com
59
59
69
74
76
Table of Contents
X
4
Size Distribution CharacterizationUsing Sedimentation Methods ............. 81
4.1 Basic Considerations ............................................................................
81
4.2 Size analysis Procedures Based on Incremental Sampling of an Initially
Homogeneous Suspension ....................................................................
86
4.3 Sedimentation Characterization Based on Cumulative Monitoring of
Sediments from an Initially Homogeneous Suspension.......................
103
4.4 Line Start Methods of Sedimentation Fineparticle Size Characterization ................................................................................................
104
4.5 Sedimentation Studies of Fineparticles Moving in a Centrifugal
Force Field ..........................................................................................
111
5
CharacterizingPowders and Mists Using Elutriation ...............................
129
5.1 Basic Principles of Elutriation ............................................................. 129
6
Stream Methods for CharacterizingFinepartides .....................................
169
Basic Concepts ...................................................................................
Resistazone Stream Counters ..............................................................
Stream Counters Based on Accoustic Phenomena ...............................
Stream Counters Using Optical Inspection Procedures .......................
Time-of-Flight Stream Counters .........................................................
169
171
179
183
190
6.1
6.2
6.3
6.4
6.5
7
Light ScatteringMethods for CharacterizingFineparticles .......................
205
205
7.1 The Basic Vocabulary and Concepts of Light Scattering .....................
7.2 Studies of the Light Scattering Properties of Individual Fineparticles .. 215
7.3 Light Scattering Properties of Clouds and Suspensions of Fine216
particles ..............................................................................................
7.4 Diffractometers for Characterizing Particle Size Distributions of
Fineparticles ....................................................................................... 217
7.5 Measuring the Fractal Structure of Flocculated Suspensions and
Aerosol Systems Using Light-Scattering Studies ..................................
224
8
Doppler Based Methods for CharacterizingFineparticles.........................
8.1 Basic Concepts Used in Doppler Methods for Characterizing Fineparticles ..............................................................................................
8.2 Stream Counters Based on Doppler Shifted Laser Light .....................
8.3 Phase Doppler Based Size Characterization Equipment ......................
8.4 Photon Correlation Techniques for Characterizing Small Fineparticles ..............................................................................................
www.pdfgrip.com
233
233
238
240
243
Table of Contents
9
Characterizing the properties of powder beds ...........................................
9.1 Parameters Used to Describe and Characterize the Properties of
Powder Beds .......................................................................................
9.2 Permeability Methods for Characterizing the Fineness of a Powder
System ................................................................................................
9.3 General Considerations ......................................................................
9.4 Fixed-pressure permeametry ...............................................................
9.5 Cybernetic Permeameters for Quality Control of Powder Production
9.6 Determining the Pore Distribution of Packed Powder Beds and
Porous Bodies .....................................................................................
10 Powder Structure Characterization by Gas Adsorption and Other
Experimental Methods .............................................................................
10.1 Experimental Measurement of Powder Surface Areas by Gas
Adsorption Techniques .......................................................................
10.2 Characterizing the Fractal Structure of Rough Surfaces via Gas
Adsorption Studies .............................................................................
XI
249
249
251
254
257
. 264
267
283
283
292
Subject Index ....................................................................................................
297
Authors Index ...................................................................................................
309
www.pdfgrip.com
Characterization of Powders and Aerosols
BrianH Kaye
copyright Q WILEY-VCH Verlag GmbH.iY9Y
1 Basic Concepts in Characterization Studies,
Representative Samples and Calibration
Standards
1.1 Who Needs to Characterize Powders and Spray Systems?
The list of industries using powders, or processes in which there is a substance used
as spray or a mist, is long and increasing. My first exposure to the problems of powder
technology began in 1955 when I studied the characterization of powders used to fabricate parts of nuclear weapons. One study involved the metal beryllium which was
used in powder form. The production of dense beryllium required powders having a
specific size and shape distribution. Beryllium powder is however a respirable health
hazard and to characterize the powder in a safe atmosphere required the development
of new methods of characterizing powders.
After working with beryllium I moved on to study nuclear reactor fabrication. In
this study I worked on determining the surface area, size and shape distributions of
uranium dioxide and plutonium dioxide powders used to fabricate fuel rods. Looking
back I see that my initiation into powder technology was a baptism of fire since all of
these powders were extremely toxic and dangerous. The technology that I studied in
those years is currently very applicable to the study of modern ceramic materials and
powder metallurgical routes to finished products [ 1, 21.
After my studies of the technology for creating nuclear weapons I soon became involved in studying the fallout from nuclear weapons tests and similar problems of
occupational diseases, such as pneumoconiosis and silicosis caused by the inhalation
of fineparticles. The study of respirable hazards in industry and from nuclear fallout
requires detailed knowledge of the shape and size of fineparticles [3, 41.
The same type of information required to predict the respirable hazard for grains
of powder is also vital to the success of therapeutic aerosol technology in which drugs
are delivered to the lungs in aerosol form [5]. The same technical information is used
by military experts to design the delivery of biological warfare agents, such as clouds
of toxic dust. The other side of the military problem is to design filters which will protect
military personnel against these toxic clouds of fineparticles; a task requiring detailed
size, shape and aerodynamic behaviour information for the aerosol fineparticles. Other
industrial activities where detailed knowledge of the size and shape distributions of
powder grains are important include industries involved in food processing, cosmet-
www.pdfgrip.com
1 Basic Concepts
2
ics, paint, pesticide manufacture and delivery, pharmaceutical products, and the manufacture of explosives, abrasive powders, metal powders used in the creation of magnetic tape, and the dry inks used in xerographic copiers.
Size characterization studies have often evolved in parallel in many of these industries and sometimes there is vocabulary confusion because of the different perspectives of scientists from the various industries. We will attempt to develop and use a
consistent terminology as we study the multitudes of powders used in various industries.
1.2 The Physical Significance of Size Measurements
If one is concerned with the characterization of dense smooth spheres, the concept
of size is elementary and straight forward. If however one must deal with some of the
powder grains found in industry, exactly what is meant by size has to be defined very
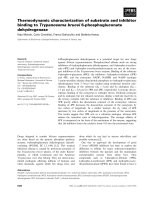
carefully. Consider for example the carbonblack profile shown in Figure 1.1(a) [6].
One measure of the structure of the carbonblack profile is it’s circle of equal area as
shown in Figure l.l(b). Another simple descriptor, which has been widely used to
describe such objects is the Aspect Ratio. This is the length, defined as the longest
dimension of the profile, divided by the width of the profile (right angles to the length
measurement.) This is a dimensionless number which is defined as a geometric index
of shape. Many different geometric shape factors have been described by different
workers [7-111
a)
b)
Circle of Equal Area
CEA
L
Aspect Ratio = AR = -= 1.43
w
Chunkiness = Ch =
L
= 0.70
Figure 1.1. To specify the size and shape of a complex fineparticle, many equivalent and operational parameters may be required, as demonstrated by the parameters required to describe
a carbonblack profile originally described by Medalia [6]. a) Simple, classical dimensions of a
carbonblack profile. b) Typical size and shape descriptors of the profile of (a).
www.pdfgrip.com
1.2 The Physical Sign;fcance of Size Meusurements
3
The reciprocal of the Aspect Ratio has recently become quite widely used to describe the shape of fineparticles. The reciprocal quantity is called the Chunkiness of
the fineparticle. (The physical significance of this measure will be discussed in Chapter 2.)
Relating the equivalent measure of a fineparticle to its physical properties is not
always easy and for this reason what is known as an operational diameter of the
fineparticle is sometimes used. Thus, the equivalent area of the carbonblack of Figure
l.l(a) is probably related to the opacity of the fineparticle when it is used as a pigment. However, if it is to be used to be part of a defensive smoke screen in a military
operation the opacity of the profile, with respect to scattered light, has to be measured and in this situation some of the diffractometer measurements discussed in Chapter 6, may be a more direct measure of the operational behavior of the profile.
Soot fineparticles produced by a combustion processes are similar in structure to
the carbonblack profile of Figure 1.1(a). When one is looking at the dispersal dynamics of a smoke and/or the health hazards of the smoke fineparticles, one must use an
operational diameter known as the aerodynamic diameter. The aerodynamic diameter
is the size of the smooth dense sphere of unit density which has the same dynamic
behavior as the soot particle. Several procedures for measuring the aerodynamic diameter of airborne fineparticles will be discussed in various chapters of this book.
When looking at a complex profile such as that of Figure 1.1(a) one can sometimes
clearly identify subunits in the structure of an agglomerate. In some instances workers report the size distribution of the subunits in the agglomerate as the operational
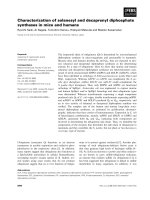
size of the fineparticle system but this can be confusing and lead to difficulty interpreting the data. Thus in Figure 1.2(a) a set of fineparticles captured on a whisker filter and studied by Schafer and Pfeifer are shown [ 121. The size distribution of the
fineparticles on the filter whiskers were studied by two methods. The distributions
reported by Schafer and Pfeifer are shown in Figure 1.2(b). It is quite surprising that
the image analysis data shows much smaller fineparticles than those that are obviously
visible under a microscope in the array of Figure 1.2(a). The reason for this is that
Schafer and Pfeifer measured what they called “obvious units” contributing to clusters which they claimed were formed on the filters as capture trees [ 131. Deciding
whether a cluster of smaller fineparticles has grown on the filter fiber or existed in the
aerosol being filtered is a value judgment for which different scientists would reach
different conclusions. In the case of the study reported by Schafer and Pfeifer the decision as to the reality of the structure of the cluster is not critical since they were studying alumina fineparticles used to create visible trails in wind tunnel experiments.
However, looking at a typical cluster such as that shown enlarged in Figure 1.2(c), if
the study had been on the health hazard of the dust, the hazard would be very different if the cluster was a single entity of the size of 3 microns long or if it was in fact 20
or 30 small particles less than half a micron in size.
www.pdfgrip.com
4
I Bark Concepts
b)
Relative
Number
of
Stated
Size
Laser Aerosol
\
\
\
\
\
o
1.o
---___
Size
\
2.0
\\
Figure 1.2.The decision as to what constitutes a separate fineparticle can lead to very different
descriptions of a fineparticle population, as demonstrated by the data reported by Schafer and
Pfeifer [ 121. a) Low magnification field of view of fineparticlescaptured in the fibres of a filter.
b) Size distributions by two different methods of the fineparticlesof (a). c) A typical agglomerate which Schafer and Pfeifer describe as constituted from “obvious” subunits which they report as the effective unit in their image analysis size distribution.
The difficulties of using image analysis in health hazard studies is demonstrated by
the profile of Figure 1.2(c). Predicting the aerodynamic diameter from the perceived
physical structure of the profile is very difficult. (See discussion of the aerodynamic
profiles of complex fineparticles in Chapter 6.) In the discussion so far of the profiles
of the Figures 1.I and 1.2, the term agglomerate has been used without definition.
Unfortunately in powder technology literature the terms agglomerate and aggregate
are used somewhat indiscriminately. One author’s agglomerate may be another author‘s
aggregate. In this book the term agglomerate is used to describe a structure which is
strong enough to persist throughout the handling of the fineparticle in the process of
interest. The term aggregate on the other hand is used to describe a temporary cluster
which breaks down during the processing of the material. This is a logical use of the
two terms since agglomerate means “made into a ball” whereas aggregate means be-
www.pdfgrip.com
1.2 The Pbysical Sipz$cance of Size Measurements
5
having like a flock of sheep. Anyone who has watched the behavior of a flock of sheep
knows that the flock assembly disintegrates as soon as the dog and the shepherd walk
away. Thus when looking at titanium dioxide powder taken out of a bag, the powder
is often clustered into aggregates as large as 20 microns in diameter but when dispersed
by high shear forces into a paint these agglomerates will breakdown into individual
fineparticles of one micron or less.
When selecting a method of size characterization to study a powder, one should try
to use an analytical procedure to disperse the powder resulting in fineparticles that will
be the same operative size as those in the process under study. Thus, ifwe were to have
a cluster of fineparticles which persisted throughout a pharmaceutical processing operation, it would be inappropriate to use a sizing procedure which used dispersing forces
strong enough to rip the cluster apart. This aspect of size characterization will be discussed throughout the text when discussing the various characterization procedures.
Again, when choosing a method of size characterization, one should always choose
a method close to the operational context for which the information is required. Thus
if one wants to study the dust movement into and out of the lung one should use a
method that actually measures the aerodynamic size of the fineparticle.
Sometimes it is necessary to measure several size description parameters for a more
complete description of a fineparticle in the operational context. For example, if one
is studying a soot fineparticle having a structure similar to that of the profile of Figure
1.1(a), one needs to know the aerodynamic diameter to predict the movement in the
atmosphere and/or into or out of the lung; however to look at the health hazard of the
fineparticle one needs to measure the structure and the surface of the fineparticle. Thus,
an open textured, fluffy soot fineparticle would have a small aerodynamic diameter
the magnitude of which would give very little indication of the probability of lodging
on the surface of the lung or to the possibility of capturing the soot fineparticle in a
respirator or filter. For such purposes, one would have to measure the physical dimensions of the profile such as the length and chunkiness.
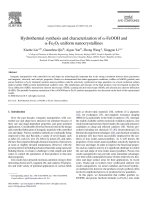
Two other parameters which would be useful when evaluating potential health hazards of fineparticles, such as the soot profile of Figure 1.1(a), are the fractal dimensions of the structure and the texture of the profile. The fractal dimension of a boundary is a concept from the subject of applied fractal geometry [ 14, 151. Fractal geometry, invented by Mandelbrot [16], describes the ruggedness of objects in various dimensions of space. (As will be pointed out in the various discussions in the use of the
term fractal in powder science, the word fractal dimension can mean different things,
in this case the word fractal dimension describes the rugged structure of the boundary
of a profile.) To describe the ruggedness of lines in two dimensional space, the fractal
dimension is a fractional addendum to the topological dimension of a line, which is
1, as illustrated for the various lines of Figure 1.3. It can be seen that this fractal addendum increases as the ruggedness, i. e. the ability of the line to fill space, increases.
www.pdfgrip.com
1 Basic Concepts
6
Topological
Dimension
Fractal
Dimension
1.oo
1.oo
1.00
/3
1.02
n
1.00
1.oo
1.25
1.45
Figure 1.3. The fractal dimension of a profile can be used to describe the ruggedness of a
fineparticleprofile. The fractal dimension consists of a fractional number, which is related to
the ruggedness or space filling ability of a profile, added to the topological dimension of a line
or other structure [13].
We will show in Chapter 2 that the carbonblack profile of Figure 1.1(a) has two fractal
dimensions, one describing the gross structure of the agglomerate and the other the
texture. The magnitude of the structural fractal dimension is about 1.32. The structural fractal dimension of the agglomerate is useful information concerning the way
in which the agglomerateformed in the smoke in which it was created.The other fractal
dimension used to describe the carbon black agglomerates, called the textural fractal
dimension, describes the texture of the agglomerate. This parameter has information
on the way in which the subunits are packed together to form the agglomerate [ 171.
The techniques for measuring the fractal dimensions of profiles such as that of Figure
1.1(a) will be described in detail in Chapter 2.
Because the various methods for characterizing aspects of a complex structure explore different aspects of that structure, the data generated from a given study of the
system may not correlate directly with data generated by another technique. From time
to time in the body of the text the differences in the data generated by different studies of the same type of population by various methods will be discussed. In the final
chapter we will collect together various comparative studies illustrative of the usefulness of the information generated by different size characterization techniques. Predicting the physical properties of a powder system from the size distribution study is
not usually a direct procedure. For this reason in Chapter 9 we will look at assessing
by direct study, physical properties of powder systems such as the flow of a powder
system, the packing of a powder assembly, and permeabiliqdporosity of compressed
powder systems.
www.pdfgrip.com
1.4 Representative Samples
7
1.3 Standard Powders for Calibrating Powder Measurement
Techniques
Sometimes the interpretation of data generated in a method for studying the size
of a fineparticle can be carried out using physical relationships. Thus when studying
the sedimentation of a fineparticle in a viscous fluid, the Stokes diameter of the
fineparticle can be established using known values of viscosities and densities along
with measured falling speeds and a well known formula developed by Stokes (see
Chapter 4). However, in other techniques, the physical significance of data generated
by a method is interpreted by carrying out calibrations using standard fineparticles.
For example, when looking at the size of fineparticles using a stream counter, such as
the HIAC system described in Chapter 6, the instrument is calibrated using standard
latex spheres. The data generated for a particular powder is then reported in terms of
the size of the equivalent spheres which would represent the fineparticles.
Standard latexes, and other reference materials, are available from various organizations [ 18-24]. One of the calibrations standards available to fineparticle scientists are
latex spheres which were made on board the space shuttle in 1985. Because these spheres
were formed in the absence of gravity they are perfectly spherical. The National Bureau of Standard makes available standard reference material in the form of ten micron microspheres mounted on glass slides. In the first type of slide a few thousand
microspheres are deposited as a regular array on a glass microscope slide. In the other
type, the fineparticles are randomly distributed [ 181. A series of standard non-spherical fineparticles have been prepared by the Community Bureau of Reference Commission of the European Community for use in comparing the performance of size
methods. These reference powders are known as BCR standards and several publications are available describing the use of such reference materials [ 191.
1.4 Representative Samples
Often in the laboratory one is given a sample of a few grams taken from a large
supply of powder. It should be self obvious that if this sample is not representative
of the original bulk supply of powder then one is wasting time characterizing the
sample in the laboratory. Unfortunately this fundamental step in powder technology is often overlooked sometimes simply because the laboratory is separated in time
and space from the original bulk supply of powder. Several times in my career I have
been in charge of laboratories providing size analysis data to other groups. When
www.pdfgrip.com
8
1 Basic Concepts
such a position I have always insisted that I would not touch a sample until I knew
how the sample had been obtained. This demand often led to discussions with the
group requesting information which resulted in new sampling strategies being put
into place to ensure that the small sample of powder delivered to the laboratory was
representative of the population to be characterized. The sampling of a very large
quantity of powder is a difficult task and several companies have developed special
equipment for taking samples from powder streams and from powder storage devices. The literature in this subject should be consulted by those faced with the decision of taking samples from very large quantities of powders (i. e. many tons of
powders) [25-321. Note that in the references the term ASTM refers to publication
by the American Society for Testing Materials and BSI stands for the British Standards Institute.
When taking samples from a large quantity of powder it should always be recognized that handling of the powder may have caused segregation. The simple act of
pouring powder from a storage device into a large canister can create segregation since,
as the air moves out of the container as the powder is moving in, finer particles can be
flushed upwards to the top of the container.
One widely used technique for sampling different regions of a powder supply is the
thief sampler shown in Figure 1.4(a) [33,34]. In this device a hollow tube with a point
is provided with several entry ports along its length. An inner tube that fits smoothly
into the outer tube is also provided with entry ports to a series of sectional containers
along its length. To use the thief the inner tube is placed in the outer tube with the
ports in a position where no powder may enter the inner tube. The tube is then thrust
into the powder supply and the inner tube rotated until powder can enter the compartments. The handle of the inner tube is then twisted further to close the ports and
the sampler withdrawn from the powder. This equipment is useful for non-abrasive
powders such as flour and other food powders but can be quickly rendered inoperative if used with an abrasive power. This is because if any of the abrasive powder is
caught between the two tubes, the abrasive grains bind the two tubes together. Literature on many different sampling devices is to be found in references 33 through 41.
In the laboratory a widely used sampling method is the spinning riffler shown in
Figure 1.4(b) [32]. This sampler was developed in response to conflicts over the accuracy of size analysis data at a time that I was operating a service lab providing particle
size analysis to various groups at the Atomic Weapons Research Establishment, England. In this sampling procedure the powder to be sampled is fed through a chute or
funnel into a rotating set of containers. For any one cup to contain a representative
sample the time of flow of the powder supply divided by a time of rotation should be
at least 100. The efficiency of this sampling device has been established by many experiments. It is available from several instrument companies, see references 33 and 42
for their names.
www.pdfgrip.com
I . 4 Representative Samples
9
Inner cylinder with
,sample chambers
a)
Holes closed
while probe is
inserted or
removed
I"(
Entry ports
!j
Holes aligned
for sampling
.
~
b)
Top View
Side View
Figure 1.4. Several devices are available for taking a small representative sample from a large
supply of powder [31, 32,341. a) A thief sampler consists of two concentric cylinders. b) The
spinning riffler can efficiently produce small, representative samples.
Although the spinning riffler has proved to be an efficient sampling device it does
have some disadvantages. First, if the powder is very fine, the spinning action of the
riffler basket may cause some of the fines in the powder to blow away. Secondly, if the
powder is cohesive, it may not flow readily through the feed funnel into the riffler
basket. For situations when one is concerned with analyzing a sample of a cohesive
powder, which will not be returned to the parent population of powder, adding a small
amount of silica flow agent will make the powder flow into the riffler and such an
addition would not normally cause problems in the analytical method (see discussion
of flowagents in reference 43).
www.pdfgrip.com
1 Basic Concepts
10
Another disadvantageof the riffler system is that a small sample size (as required by
some modern size characterization methods) requires many successive rifflings and the
cleaning of the apparatus can be tedious and time consuming.
A recently developed technique for obtaining a representative sample of a powder
which overcomes some of these problems is shown in Figure 1.5. This new system
exploits the idea that if one can mix a quantity of powder so that it is a homogeneous
population, any small sample taken at random from the population is a representative
sample. Since the sampling chamber used in this new method is sealed any problems
due to very fine powders and/or cohesive powders are eliminated [44]. The sampling
device is called a free fall tumbling mixer/ sampler device. A commercial version of
the equipment, known as the AeroKaye" mixer/sampler, is available from Amherst
Process Instruments Inc. [45]. The powder to be sampled is placed in a container
equipped with a lid carrying a sample cup as shown in Figure 1.5(a). When assembled
a)
Carrier Cap
-
)
-
Container Lid
Replaceable
Sample Cup
Powder /
Container
KIA
Carrier-.
Cube
b)
Tumbling Drum,
With the jar closed and the
carrier cube assembled, the cube
is placed into the drum where the
dimpled lining helps to carry the
cube to a sufficient height before
it tumbles chaotically, again
aided by the dimples, to the
bottom of the drum.
Rollers
/
'
Dimpled
Lining
Motor
Figure 1.5. In the free-fall tumbling mixer, a powder to be sampled is homogenized in a sample jar which tumbles chaotically in a rotating drum. After the tumbling, any sample taken at
random from the powder is a representative sample. It is convenient to take random samples
using a sampling cup mounted to the lid of the jar [43,44].
www.pdfgrip.com
1.4 Representative Samples
11
the sample cup will be within the body of the powder in the container when the container is upright. The sample container, complete with lid and the required sample
cups, is placed in a carrying cube as shown in Figure 1.5(a). When the carrier cube is
placed in the rotating tumbler drum where it tumbles chaotically. As a consequence
the powder in the container tumbles chaotically and is thoroughly mixed andlor homogenized. When the cube is removed from the tumbler and the sample cup is retrieved, it will contain the desired representative sample of the powder in the container.
Several different sizes of carrying cubes are available and various models of the rotating drum facilitate sampling from small amounts, less than one hundred grams, to
amounts of several hundreds of grams. One of the advantages of this sampling device
is that the size of the sampling cup can be changed to obtain a sample of the required
size directly. Thus, for use with a time-of-flight aerosol spectrometer, a stream method
which will be discussed in detail in Chapter 6, a sample of less than one gram can be
obtained directly using a small sample cup. O n the other hand, if a larger amount is
required for another method of characterization, a larger sample cup can be used. Several
sampling cups of different sizes can be mounted on the lid at the same time.
The performance of this equipment has been demonstrated by making measurements on the samples using the AerosizeP, described in Chapter 6 [45],as illustrated
by the data of the graph of Figure 1.6. In these tests a cohesive fine calcium carbonate
powder was placed in the mixing chamber which was tumbled in the rotating drum
system. A one cubic centimeter cup was used to take a sample of powder which was
then characterized using the AerosizeP. After a second period of tumbling another
sample was taken and it can be seen that the two sets of data are virtually indistinguishable.
-
-
-
Normalized
-
Volume
-
0.00.1
0.2
0.5 1.0 2.0
I
l
5.0 10
Geometric Diameter
(wm)
l
20
I
50
1
Figure 1.6. Two samples of calcium carbonate from a bulk sample homogenized in the freefall tumbler of Figure 5, taken several minutes apart, exhibit virtually identical size distributions.
www.pdfgrip.com
1 Basic Concepts
12
-
-
-
- -- ---
Normalized
Cumulative 0.5-Volume
0.0
I
I
l
l
I
l
l
I
l
l
Normalized
Cumulative 0.5volume
0.1
0.2
0.5 1.0 2.0
5.0 10 20
Geometric Diameter (pm)
Geometric Diameter (pm)
50 100
0
Figure 1.7. The free-fall tumbling mixer can work efficiently with initially completely segregated cohesive powders [44].a) Size distributions of the two original calcium carbonate powders. b) Progress of mixing for a sample containing 25 Yo by weight of 6 pm product and
75 Yo by weight of the 15 pm product. Note that the two powders were initially completely
segregated in the mixing chamber. c) After 20 minutes of mixing the measured size distribution of the mixture was virtually identical to the mathematically calculated size distribution
based on the size distributions of the two individual powders.
www.pdfgrip.com
1.5 Representative Samplesfiom Suspensions and Aerosol Clouds
13
As mentioned earlier the basic concept of the new sampling device is that it mixes
powders so well that one can take any small subsection of the material as a representative sample. To demonstrate the mixing efficiency of the device two fine cohesive calcium carbonate powders were placed in the container in the proportions 25 Yo of a
nominally 6 micron calcium carbonate and 75 %, 15 micron calcium carbonate. The
size distribution of the two powders are shown in Figure 1.7(a). The portions of the
two powders were placed as layers in the container. Samples were taken at various times
after mixing by tumbling was initiated and the size distributions of the samples are
shown in Figure 1.7(b). The mixture did not immediately achieve homogeneity but
within 20 minutes the measured size distribution of the material was virtually indistinguishable from the calculated size distribution of the mixed powders as illustrated
by the data of Figure 1.7(c). It should be appreciated that the mixing together of two
such fine cohesive powders is a very difficult task and the fact that it was achieved within
20 minutes is in itself noteworthy. Using normal powders to be sampled in the laboratory, much shorter tumbling times would be adequate. It is relatively cheap to provide the technologists with different disposable sampling cups and many different
mixing chambers can be placed in carrier cubes to facilitate the use of the standard
bottles used in any given laboratory. The only caution is that the container to be used
in the carrier cubes should be a relatively squat configuration and should never be filled
more than half full to facilitate the random motion of the powder during the chaotic
tumbling of the carrier cube. Sometimes if one is working the large grained, free-flowing
powder it may be necessary to place a randomizing paddle in the mixing chamber.
Useful information on other powder sampling equipment is available from the manufacturers cited in references 33 and 46.
1.5 Representative Samples from Suspensions and Aerosol Clouds
One can often take a sample from a suspension using a pipette but in such instances
one must be aware that the rate of suction can bias the results. This factor will be discussed in more detail in Chapter 4.
When taking a sample from a liquid suspension process stream, a useful and efficient sampling device is the Isolock@sampler shown in Figure 1.8 [47].The Isolock'
sampler is fitted with a retractable piston consisting of two parts. In the passive position shown in Figure 1.8(a) the front of the piston sticks into the flowing suspension
where it has the useful purpose of creating turbulence in the suspension which facilities efficient sampling of the suspension. The back section of the piston seals the sampling bottle/pipe system from the flowing suspension. When activated, the piston is
www.pdfgrip.com
I Basic Concepts
14
a) Piston extended for sampling
Suspension Flow
Piston
Actuating Rod
Sample Container
b) Piston retracted to capture sample
>I,
Suspension Flow
_.:,". ;
.:. . . .
. . . . . . . .. .. .
.
.
.. .._,'
,.
'
.
.
. . . . ;. ....
: ;.- ,: , . :. ,
. . . . ,. . .1 .. ' . . :
.
'
"
Sample of suspension
to be characterized
Figure 1.8.The Isolock sampler is used to take samples of suspensions or slurries containing
fineparticles to be characterized [47].
withdrawn so that some sample flows into the bottle before the retreating front of the
piston seals the entry orifice as shown in Figure 1.8(b). In a typical industrial process
the piston would be activated relatively rapidly to take a small portion of suspension
into the holding bottle. The piston would be activated several times over an appropriate time period so that the eventual sample filling the bottle consists of several small
sub-samples drawn from the process pipe aver a period of time. When taking samples
from a flowing suspension one should always be careful to create turbulence immediately in front of the sampling device. One should never operate a device such as the
Isolock@sampler near a bend in the pipe since all bends create centrifugal forces which
tend to segregate the particles flowing in the suspension by size.
To obtain samples of fineparticles constituting air pollution and other aerosol systems, many different devices have been developed for filtering the fineparticles onto
www.pdfgrip.com
1.5 Representative Samplesfiom Suspensions and Aerosol Clouds
15
paper or glass fiber filters. Many of the devices used to filter aerosol fineparticles
fractionate the airborne fineparticles by means of twists and bends in the equipment
and are known as elutriators. Many of the advanced aerosol sampling devices will be
discussed in detail in Chapter 5, after we have developed the basic concepts of elutriation
and fineparticle fractionation in a moving fluid.
Two special types of filters which can be used to filter aerosols are shown in Figure
1.9(a) and (b). T h e filter in Figure 1.9(a) is known as a Nuclepore@filter [48].This
type of filter is made by bombarding a thin film of polycarbonate with subatomic
particles emerging from a nuclear reactor. T h e flux of the subatomic particles is ori-
Flow
C)
Precise
I
-
Flow
t
Tortuous
Pathways
of varying
-
-
100
10 microns
Nuclepore membrane
Depth filter
Figure 1.9. Special filters can be used to capture aerosol fineparticles for study by image analysis and other methods of characterization. a) Appearance of the surface of a Nuclepore filter. b)
Appearance of the surface of a membrane filter with the same rating as the Nuclepore of (a). c)
Structure of the filters of (a) and (b) as they would appear in cross-section.The Nuclepore is a
surface filter while the membrane filter is a depth filter.
www.pdfgrip.com