A beginners guide to mass spectral interpretation
Bạn đang xem bản rút gọn của tài liệu. Xem và tải ngay bản đầy đủ của tài liệu tại đây (4.01 MB, 240 trang )
Document
www.pdfgrip.com
Página 1 de 1
Page iii
A Beginner's Guide to Mass Spectral Interpretation
Terrence A. Lee
Middle Tennessee State University
Department of Chemistry
Murfreesboro
TN 37132
USA
/>
29/09/2003
Document
www.pdfgrip.com
Página 1 de 2
Page iv
Copyright © 1998 John Wiley & Sons Ltd,
Baffins Lane, Chichester,
West Sussex PO19 1UD, England
National 01243 779777
International (+44) 1243 779777
e-mail (for orders and customer service enquiries):
Visit our Home Page on
or
All Rights Reserved. No part of this publication may be reproduced, stored in a retrieval system, or
transmitted, in any form or by any means, electronic, mechanical, photocopying, recording, scanning or
otherwise, except under the terms of the Copyright Designs and Patents Act 1988 or under the terms of
a licence issued by the Copyright Licensing Agency, 90 Tottenham Court Road, London W1P 9HE,
UK, without the permission in writing of the Publisher
Other Wiley Editorial Offices
John Wiley & Sons, Inc., 605 Third Avenue,
New York, NY 10158-0012, USA
WILEY-VCH Verlag GmbH, Pappelallee 3,
D-69469 Weinheim, Germany
Jacaranda Wiley Ltd, 33 Park Road, Milton,
Queensland 4064, Australia
John Wiley & Sons (Asia) Pte Ltd, Clementi Loop #02-01,
Jin Xing Distripark, Singapore 129809
John Wiley & Sons (Canada) Ltd, 22 Worcester Road,
Rexdale, Ontario M9W 1L1, Canada
Library of Congress Cataloging-in-Publication Data
Lee, Terrence A.
A beginner's guide to mass spectral interpretation / Terrence A.
Lee.
p. cm.
Includes bibliographical references (p. - ) and index.
ISBN 0-471-97628-8 (hardcover : alk. paper).-ISBN 0-471-97629-6
(pbk. : alk. paper)
1. Mass spectrometry. I. Title.
QD96.M3L44 1998
547'.3'0873-dc21
97-28548
CIP
British Library Cataloguing in Publication Data
/>
29/09/2003
Document
www.pdfgrip.com
Página 2 de 2
A catalogue record for this book is available from the British Library
ISBN 0 471 92628 8 (cloth)
ISBN 0 471 97629 6 (paper)
Typeset in 10/12 pt Times Roman by Techset Composition Ltd, Salisbury, Wiltshire.
Printed and bound in Great Britain by Bookcraft (Bath) Ltd
This book is printed on acid-free paper responsibly manufactured from sustainable forestry, in which at
least two trees are planted for each one used for paper production
/>
29/09/2003
Document
www.pdfgrip.com
Página 1 de 1
Page v
Dedication
This book is dedicated to Joyce Jamil, Myron Jones and Nathan Hurt, who as students at
Middle Tennessee State University provided the inspiration to write this manual. In
addition to the students who inspired this book, the author also dedicates this book to Lisa
A. Lee and Krista D. Lee, my wife and daughter, who have encouraged and supported all
of my efforts.
/>
29/09/2003
Document
Página 1 de 2
www.pdfgrip.com
Page vii
Contents
Acknowledgements
ix
Introduction
xi
Chapter 1
Isotope Abundances and How we Use them
1
Chapter 2
Identification of the Molecular Ion
5
Chapter 3
General Interpretation Procedures
9
Chapter 4
Hydrocarbons
22
Chapter 5
Halogenated Hydrocarbons
47
Chapter 6
Alcohols
60
Chapter 7
Ethers and Phenols
72
Chapter 8
Aldehydes and Ketones
79
Chapter 9
Esters and Acids
91
Chapter 10
Nitrogen-Containing Compounds
106
Chapter 11
Thiols and Thioethers
117
Chapter 12
Heterocyclic Compounds
126
29/09/2003
Document
Página 2 de 2
www.pdfgrip.com
Chapter 13
Unknowns
133
Appendix
Detailed Solutions to Unknowns
153
Bibliography
180
Topic Index
183
Index of Compounds and Spectra
184
29/09/2003
Document
www.pdfgrip.com
Página 1 de 1
Page ix
Acknowledgements
The author would like to acknowledge the help and encouragement of the following organizations and
individuals in preparing this manual.
The author acknowledges and thanks the National Institute of Standards and Technology for permission
to use portions of data from the NIST/EPA/NIH Mass Spectral Database in producing the spectra used
in this book.
The author thanks Drs Andrienne C. Friedli, Paul C. Kline and Martin V.B. Stewart (Middle Tennessee
State University) who reviewed and edited the manuscript and provided many valuable insights and
suggestions.
/>
29/09/2003
Document
www.pdfgrip.com
Página 1 de 1
Page xi
Introduction
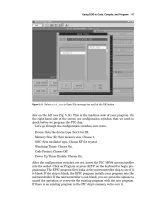
Over the last 20 years, there has been tremendous growth in the area of mass spectrometry. Small,
powerful and reasonably priced mass spectrometers, commonly interfaced with either a gas or a liquid
chromatograph, are found in the laboratories of universities, governmental agencies and private
companies. Most of these instruments are controlled by some type of desktop computer, which makes
data acquisition, storage, manipulation and presentation relatively simple and painless. The ability to
separate complex chemical mixtures and identify the components provides an indispensable tool for
scientists and technicians responsible for monitoring environmental pollution, investigating crime,
controlling chemical processing and developing new products. It is not unusual to find students learning
to operate these instruments as part of the normal undergraduate curriculum, and many of these students
will take industrial or governmental positions where they will routinely operate similar instruments.
Unfortunately, it is all too often the case that what is missing from this picture is the interpretation of
the data (the mass spectrum). In the undergraduate chemistry curriculum, spectroscopy and spectral
interpretation are normally introduced during the organic chemistry sequence. Typically, one or two
chapters of the textbook will be devoted to mass, infrared and nuclear magnetic resonance
spectrometry. In general, the emphasis is given to NMR, with IR given secondary importance and MS
relegated to third place. A few sample spectra will be presented to illustrate key points for each method.
There may even be some sample problems showing how the three techniques can be used to
complement each other, providing a positive identification of the unknown compounds. Given the mass
of material normally covered in organic chemistry, it would be unreasonable to devote large amounts of
time (lectures and laboratories) and resources (pages in the textbook) to cover each of these spectral
techniques thoroughly.
A logical question is, when are students supposed to learn to identify spectra? Many colleges and
universities offer separate courses covering spectral techniques and interpretation. Many more do not.
In those universities having these courses, completion of the course is required of all chemistry majors,
some chemistry majors or no chemistry major. The courses are offered regularly, infrequently or rarely.
Evidently, the most common answer to the question 'When?' is 'Whenever'.
How are students supposed to learn to identify spectra? If a course in spectral interpretation is offered,
then the student has the opportunity to learn identification techniques in some sort of systematic
fashion. If there is no formal course the student is left to his/her own devices.
Why should students learn to identify mass spectra? The mass spectrum of an organic compound
contains a huge amount of information about the identity of the
/>
29/09/2003
Document
www.pdfgrip.com
Página 1 de 2
Page xii
compound, but this information is available only to those who know how to extract it from the
spectrum. Almost all bench top mass spectrometer systems will have a standard library of mass spectra
loaded into the computer, in addition to library search software. A very common occurrence in the
undergraduate laboratory is for the student to perform a library search and to report the number one
search result as the compound's identity.
This is unacceptable. Mass spectral libraries typically contain from 80 000 to 250 000 spectra, yet there
are tens of millions of known organic compounds. The dream of having a mass spectral library of all
known organic compounds is probably hopeless. If the compound being analyzed is fairly common,
then its spectrum may be in the library. If a reference spectrum of the 'unknown compound' is not
present in the library, then no reasonable search result can be obtained. In this case, any 'result' reported
by the computer is less than useless. Not only is it not a correct identification of the unknown
compound, it is often very misleading.
This is not an indictment of instrument manufacturers or the producers of mass spectral libraries.
Libraries of standard mass spectra are intended to be an aid to identification, not a replacement for
interpretation. I have used this type of computerized library search hundreds of times, but only as a
supplement to, and not as a replacement for, my ability to interpret the mass spectrum. This is a
distinction that can easily be overlooked by anyone who routinely operates these types of systems.
We now come to the reason why I wrote this book. One of the most critical questions that an analyst
must answer is 'What is this material?'. With the replacement of classical wet-chemical methods of
analysis (organic qualitative analysis) by instrumental methods, the ability to identify compounds from
their spectra is crucial. In this book I have chosen to limit our focus to the interpretation of mass
spectra. Specifically, we are going to concern ourselves with a systematic method for interpreting
electron impact mass spectra of the type produced by modern bench top equipment.
In preparing this book, I made several choices which I hope will be viewed as reasonable. I have chosen
to focus on interpretation, to the exclusion of other topics traditionally covered in books about mass
spectrometry. These other topics include the historical development of MS, the production of ions by
various ionization techniques, introduction of the sample into the spectrometer and the various types of
spectrometer such as single-focusing, double-focusing, time of flight, and so on. This material is
valuable but it does not directly help the student learn how to extract information from the spectra. For
those students interested in other mass spectrometric techniques, a bibliography is included at the end of
this book.
I have chosen to limit coverage to the kinds of compounds that the average student is likely to
encounter in organic chemistry. I have taken a functional group approach in order to focus on the
typical fragmentations observed for various classes of organic compounds. I have avoided, for the most
part, compounds containing multiple functional groups, biologically significant compounds, and
polymers.
The source of the spectra used in this book is the National Institute of Standards and Technology
(NIST) Mass Spectral Database. Data from the NIST/EPA/NIH Mass Spectral Database is used with
permission from NIST.
An important part of learning about any scientific subject is learning the language used by the scientists
to describe the phenomena they are studying. Some of the standard terminology and symbols used in
mass spectrometry are defined below.
29/09/2003
Document
www.pdfgrip.com
Página 1 de 2
Page xiii
α, alpha cleavage
The breaking of a bond to an atom adjacent to the atom
containing the odd electron (not the bond to the atom
containing the odd electron).
'A' element
An element that is monoisotopic.
'A + 1' element
An element with an isotope that is 1 amu above that of the
most abundant isotope, but which is not an 'A + 2' element.
'A + 2' element
An element with an isotope that is 2 amu above that of the
most abundant isotope.
amu
Atomic mass units. For our purpose, the sum of the protons
and neutrons in the nucleus (12C = 12 amu).
base peak
The peak (or line) in the spectrum that represents the most
abundant ion.
daughter ion
The product produced by some sort of fragmentation of a
larger ion (see parent ion, below).
EE+, even-electron ion
An ion in which the outer electrons are fully paired.
EI
Electron ionization (or impact).
eV
Electron volts
isotopic peak
A peak (or line) in the spectrum that corresponds to the
presence of one or more heavier isotopes in an ion.
m/z
The mass of an ion divided by the electrical charge of the
ion. Normally, the charge is + 1. Sometimes m/e is used
synonymously.
molecular ion, M+.
The ionized form of the molecule. The 'molecular ion' is the
peak (or line) in the spectrum corresponding to a molecule
that is composed solely of the most abundant isotope forms.
Sometimes 'parent ion' and 'parent peak' are used.
Frequently, 'M', 'M + 1', 'M + 2', etc. will be used to indicate
the molecular ion and isotopic peaks.
n-electrons
Non-bonding electrons
29/09/2003
Document
www.pdfgrip.com
OE+., odd-electron ion
An ion with one unpaired electron in the outer shell. Also
known as a radical ion.
parent ion
The ion which is decomposing or breaking apart.
π-electrons
Electrons in double or triple bonds, or in aromatic ring
systems such as benzene.
R + DB
The number of rings and double bonds. This is a
measurement of the saturation of a compound. Completely
saturated compounds (such as propane) will have 0 for the R
+ DB.
relative abundance
The abundance of a given ion relative to the base peak.
Usually, the base peak is set to 100%.
σ, sigma cleavage
A simple cleavage reaction taking place by the ionization
and breaking of a sigma bond.
simple cleavage
A reaction which involves the breaking of one bond.
Página 2 de 2
Movement of a pair of electrons.
Movement of a single electron.
29/09/2003
Document
www.pdfgrip.com
Página 1 de 1
Page 1
1—
Isotopic Abundances and How we Use them
The chemical elements making up our world exist in several different forms, known as isotopes. The
term 'isotope' is used to describe atoms of an element with varying numbers of neutrons. Carbon occurs
in two naturally occurring isotopic forms: 12C, having six protons and six neutrons, and 13C, having six
protons and seven neutrons. Most of the elements in the Periodic Table will have two or more isotopic
forms. Some of these isotopes are radioactive and some are non-radioactive. The non-radioactive
isotopes are known collectively as 'stable isotopes'. All isotopes of an element are chemically identical.
They participate in identical chemical reactions and share identical chemical properties, with the
exception that some reaction rates (or properties) will vary owing to differences in mass.
One of the simplest examples of how mass can affect the rate of a process is to look at the effusion of
uranium hexafluoride (UF6) through a porous plate. Uranium exists predominantly as two isotopes, 235U
and 238U. Graham's law of effusion tells us that the relative rates of effusion for two gases at the same
temperature are given by the inverse ratio of the square roots of the masses of the gas particles.
Mathematically
where the superscript 1/2 represents taking the square root of the mass of the gas.
The molecular weight of 235UF6 is approximately 349 amu, and that of 238UF6 is approximately 352 amu.
If we assign (arbitrarily) 235UF6 as gas 1, then the ratio of the square roots of the masses is
which indicates that the isotope with the lower mass will effuse at a faster rate than the higher mass
isotope. This higher rate amounts to about 0.4%, which is a typical isotope effect.
What about the magnitude of this isotope effect for smaller organic molecules? Well, a similar
calculation can be made for a molecule such as benzene. The molecular weight of a benzene molecule
made from only 12C and 1H would be 78 amu. The molecular weight
/>
29/09/2003
Document
Página 1 de 2
www.pdfgrip.com
Page 2
of a benzene molecule containing one 13C atom would be 79 amu and the ratio of the square roots of
these masses would be
and there would be approximately a 0.6% difference in effusion rate.
The largest isotope effect is normally seen when significant amounts of 2H (deuterium) are present in a
relatively small molecule. If we make a similar calculation to those above comparing ordinary water
with monodeuterated water, we would see that the ratio is 1.027 or there is an approximate 2.7%
difference in the effusion rate. This is a fairly extreme example of an isotope effect. For most
applications, the isotope effect is insignificant and can be ignored.
Naturally occurring isotopes, either stable or radioactive, do not occur in equal amounts. Naturally
occurring 13C has an abundance of about 1.1%; i.e. out of 1000 carbon atoms chosen at random, about
11 of them will be the heavier 13C isotope and the other 989 will be 12C. Although 14C occurs in nature,
the natural 14C abundance is so low as to be undetectable by ordinary mass spectrometric methods. It is
fortunate that, for the elements commonly found in organic compounds, the heavier isotopes are lower
in abundance. The natural isotopic abundances of common elements found in organic compounds are
given in Table 1.
By convention, we normally designate oxygen, sulfur, silicon, chlorine and bromine as 'A + 2' elements.
This is because the important isotopes of these elements differ from
Table 1 Mass and relative abundance of common organic elements
Elements containing only one important isotopic form
Element
Mass
H(A)
1
F(A)
19
P(A)
31
I(A)
127
Elements containing two important isotopic forms
Element
Mass
% Abundance
Mass
% Abundance
C(A + 1)
12
100
13
1.1
N(A + 1)
14
100
15
0.37
Cl(A + 2)
35
100
37
32.5
Br(A + 2)
79
100
81
98.0
O(A + 2)
16
100
18
0.20a
Elements containing three important isotopic forms
Element
Mass
%
Abundance
Mass
%
Abundance
Mass
Si(A + 2)
28
100
29
5.1
30
% Abundance
3.4
/>
29/09/2003
Document
S(A + 2)
Página 2 de 2
www.pdfgrip.com
32
100
33
0.80
34
4.4
aOxygen-17
is found at about 0.04% natural abundance. The percentage abundances listed for the other
isotopes are normalized to the most common form.
/>
29/09/2003
Document
www.pdfgrip.com
Página 1 de 1
Page 3
each other by two mass units. Carbon and nitrogen are designated as 'A + 1' elements because their
isotopes differ by one mass unit. Elements having no important naturally occurring isotopes are
designated as 'A' elements, and include hydrogen, fluorine, phosphorus and iodine.
The appearance of isotopically shifted lines in a mass spectrum provides the analyst with information
about the molecular formula of the compound or ion that corresponds with the lines. One of the earliest
steps in interpreting a mass spectrum is to determine if any A + 2 elements are present. In the case of Br
or Cl this can normally be accomplished by inspecting the high mass region of the spectrum, looking
for the characteristic isotope patterns produced by these elements. Compounds containing a single
chlorine atom will exhibit a pair of lines, separated by 2 amu and in a relative abundance ratio of about
3:1. Compounds containing a single bromine atom will also exhibit a pair of lines separated by 2 amu
but the ratio will be almost 1:1. Similarly, Si or S can be detected by means of their isotopic pattern.
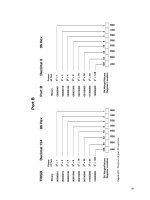
When more than one atom of these A + 2 elements is present in a molecule, the spectrum will become
more complex. Clusters of lines will be present at intervals of 2 amu and the spectra of compounds
containing multiple Cl or Br atoms (or Cl and Br together) are more complex. The following isotope
patterns (Figure 1.1) produced by Cl, Br, Si and S are the most important because they are those most
often encountered.
Methods for determining the number of halogens and their identities in polyhalogenated compounds
will be presented in Chapter 5.
For the purpose of identifying an organic compound, the most important of the A + 1 isotopes is 13C.
The presence of this isotope at an abundance of about 1.1% allows the analyst to calculate the number
of carbons present in a molecule or ion fragment. Suppose we have two lines, separated by 1 amu. If
carbon is present in the molecule (or ion fragment) associated with these lines, then it would be
reasonable to assume that the line of higher mass (designated the m + 1 line) would contain 13C,
whereas the line of lower mass (designated the m line) would contain 12C. We can divide the intensity
of the 'm + 1' line by the intensity of the 'm' line, obtaining the ratio of (m + 1)/m. Dividing this ratio by
0.011 will give us an indication of the number of carbon atoms present in the molecule.
For example, look at the spectrum of methane (Example 1 in Chapter 4). At the high mass end of the
spectrum, we observe lines at m/z 17 and 16. The ratio of the intensities of these two lines is 1.6/100 or
0.016. Dividing this ratio by 0.011 gives us 1.4 as a result. This value indicates that we have at least one
carbon atom and certainly fewer than two carbon atoms. For another example of this procedure,
consider the high mass region in the spectrum of butane (Example 3 in Chapter 4). Here we have lines
at m/z 58 and 59 with a ratio of 0.042. Dividing this ratio by 0.011 gives us 3.8 as a result, which
indicates the presence of more than three carbons but fewer than five carbons.
Notice that in our two examples the final results were not whole numbers. This is often the case, and a
certain amount of care must be used when calculating the number of carbon atoms present in a molecule
or ion fragment. A variety of factors can affect the relative intensities of lines in a mass spectrum, and
not all lines are due solely to the presence of isotopes.
Although the presence of nitrogen can be determined by its 15N isotope, it is normal to use the nitrogen
rule (Chapter 2) to determine whether or not this element is present in a given compound. This is
because of the relatively low abundance of 15N (0.37%). Similar
/>
29/09/2003
Document
www.pdfgrip.com
Página 1 de 1
Page 4
Figure 1
difficulties are encountered with oxygen and the 18O isotope. This A + 2 element has an isotopic
abundance of 0.20%, and its presence or absence is determined by other methods that will be described
in later chapters.
As a general rule, once a compound exceeds about six carbons, the direct determination of nitrogen and
oxygen by their respective isotope peaks becomes very difficult. This difficulty is due to the normal
isotopic abundance of 13C. For a C6 compound, the abundance of the A + 1 line due to 13C is about 6.6%
and that of the A + 2 line is about 0.18%. The abundance of the A + 2 line is caused by the possibility
of having two 13C atoms in the molecule. As the number of carbon atoms in a molecule increases, the
corresponding intensities the A + 1 and A + 2 lines increase, making the direct determination of
nitrogen and oxygen from their isotopic abundances extremely difficult or impossible.
/>
29/09/2003
Document
www.pdfgrip.com
Página 1 de 1
Page 5
2—
Identification of the Molecular Ion
The first step (and arguably the most important) in the interpretation of a mass spectrum is the
identification of the molecular ion (also known as the parent ion). The molecular ion is the ionized form
of the neutral compound. For example, if the molecule we are interested in is methane (CH4), the
molecular ion will be CH4+ (a molecule of methane minus 1 electron).
Unfortunately, not all compounds will produce a molecular ion that is stable enough to be seen in a
mass spectrum. Many alcohols, esters and carboxylic acids, among others, will not exhibit any
significant intensity at the m/z value corresponding to the molecular ion. How then can we determine if
a particular m/z value represents the molecular ion?
In order for a particular m/z value to be assigned as the molecular ion, three criteria must be met. If the
m/z value meets all three criteria, it may be the molecular ion. If it does not meet all three criteria, it is
not the molecular ion.
1. The molecular ion must be the highest mass ion in the spectra, discounting isotope satellites. This is
because the molecular ion is the ionized form of the compound. Fragments from this parent compound
are responsible for the other lines found in the spectrum of the compound. In the spectrum of a pure
compound, it makes little sense to investigate a line at m/z 80 as a potential molecular ion when there is
another line at m/z 96.
Allowances are made for isotope effects. For example, in the spectrum of methane, the highest m/z
value will be at m/z 17. This is not the molecular ion but instead is due to the 13C form of methane.
Typically, the molecular ion will have an even mass value. Compounds containing only C, H, O, F, Cl,
Br, I, Si, P and S will have even molecular weights. Consider the following representative compounds:
Compound
Formula
Nominal mass
Ethane
C2H6
30
Octane
C8H18
114
Ethanol
C2H6O
46
Propanoic acid
C3H6O2
74
Dichloromethane
CH2Cl2
84, 86, 88 (isotopes)
Hexafluoroethane
C2F6
138
Carbon disulfide
CS2
76
Iodomethane
CH3I
142
/>
29/09/2003
Document
www.pdfgrip.com
Página 1 de 2
Page 6
All of these compounds will have even masses because of the nature of the elements from which they
are composed. Elements having an even atomic mass also have an even valence, and those elements
with an odd atomic mass have an odd valence:
Element
Mass
Valence
H
1
1
C
12
4
O
16
2
F
19
1
Si
28 (30)
4
P
31
3
S
32 (34)
2
Cl
35 (37)
1
Br
79 (81)
1
I
127
1
The exception comes with N-containing compounds. This is because, although N has an even atomic
mass (14), it has an odd valence (3). This leads to what is described as the nitrogen rule:
A molecule containing an odd number of nitrogens will have an odd molecular weight, while a compound
containing no nitrogens or an even number of nitrogens will have an even molecular weight.
2. The ion must be an odd-electron (OE) ion. Ionization involves the collision of an electron with a
molecule, resulting in the production of the molecular ion by removal of an electron:
A relatively simple example can be seen in the ionization of methane (CH4). In the methane molecule
there are six electrons from the carbon and four electrons from the hydrogens for a total of ten electrons.
During ionization one of these electrons is removed, and the resulting molecular ion has nine electrons.
The most convenient way of determining whether or not an ion is an odd-electron ion is by calculating
the saturation index. The saturation index is simply the number of rings and/or double bonds (R + DB)
that a molecule possesses and is calculated from the molecular formula. The saturation index is found
by the following calculation.
For the general formula CxHyNzOn:
The total number of rings + double bonds = x - 1/2y + 1/2z + 1
Note that the number of oxygens present plays no part in calculating the saturation index.
If there are elements present in the molecular formula that are different from the four listed above in the
general formula, then:
/>
29/09/2003
Document
www.pdfgrip.com
Página 2 de 2
Si is treated as if it were C
P is treated as if it were N
S is treated as if it were O
F, Cl, Br and I are treated as if they were H
/>
29/09/2003
Document
www.pdfgrip.com
Página 1 de 1
Page 7
Notice that the valence of the elements plays an important role in this calculation. H, F, Cl, Br and I all
have a valence of 1, Si and C have a valence of 4, P and N have a valence of 3 and S and O have a
valence of 2.
Let us look at some examples to make sure that the process of calculating the saturation index is clear.
Consider the methane molecule, CH4. Calculation of the saturation index gives
Since 0 is a whole number, this indicates that this ion is an odd-electron ion and therefore could be the
molecular ion. All odd-electron ions will result in saturation indices that are whole numbers. The result
also indicates that there are no rings or double bonds present in the molecule.
Consider benzene (C6H6). Calculating the saturation index gives us
once again resulting in a whole number. Benzene contains three double bonds, forming one ring.
What happens when oxygen is present? Let us perform the calculation on benzoic acid (C7H6O2).
Once again we would have an odd-electron ion containing a total of five rings plus double bonds. A
glance at the structure of benzoic acid (Figure 2.1) would show that it does indeed contain a total of five
rings plus double bonds; three C=C, one C=O and the benzene ring.
Another example. We determine that a reasonable formula for a particular m/z value would be C7H5O.
The saturation index is:
Since the saturation index is not a whole number, this indicates that the ion is an even-electron (EE) ion
and cannot be the parent. This is an important characteristic of even-electron ions-they will never have
whole number values for their saturation index. It also indicates that in this ion there is a total of five
rings plus double bonds. It does not tell us how many of each (rings and double bonds) are present,
although we may be able to propose a structure for this ion if we know the molecular formula of the
parent compound.
Figure 2.1
/>
29/09/2003
Document
www.pdfgrip.com
Página 1 de 1
Page 8
Consider the formula for pyridine, C5H5N. Calculation of the saturation index gives us
Since this value is a whole number, this ion is an OE ion and could be the molecular ion. This ion also
has a total of four rings plus double bonds. Note in this case that the mass of pyridine is 79. This is an
odd mass but is allowable because of the nitrogen rule.
Students are advised to use this procedure with caution. While it is true that all molecular ions will be
odd-electron ions, not all odd-electron ions are molecular ions. Many compounds can form odd-electron
ions by breaking two chemical bonds. The most common type of reaction producing an odd-electron
ion that is not the parent ion is the McLafferty rearrangement. In this reaction, a small neutral molecule
is ejected from the parent compound. The neutral molecule will commonly have an even mass. Specific
examples of this type of reaction will be discussed in later chapters.
One additional word of caution. From time to time, the student will calculate a saturation index with a
negative value. This negative value indicates that the molecular formula is incorrect, and the most
common cause is that there are not enough carbons present in the proposed molecular formula. If this
happens, the student should increase the number of carbon atoms by 1, generate a new molecular
formula and re-calculate the saturation index.
3. The compound represented by the molecular ion must be capable of producing the important ions in
the 'high mass' region of the spectrum. High mass is of course a relative term, and the spectrum of a
compound with a molecular ion at m/z 60 will have a different high mass region from a compound with
a molecular ion at m/z 200. We will expend a good deal of effort on this topic in later chapters.
While the calculation of the molecular formula is a very important step in the interpretation of a mass
spectrum, an equally important step is the determination of the structural formula. The exact
arrangement of the atoms will have significant effects on the appearance of the mass spectrum. A
correct molecular formula reduces the number of possibilities by eliminating immense numbers of
chemical compounds that cannot produce a given spectrum, but it cannot indicate the specific structural
isomer (except for very simple compounds).
/>
29/09/2003
Document
www.pdfgrip.com
Página 1 de 1
Page 9
3—
General Interpretation Procedures
We are now ready to begin our systematic study of the interpretation of mass spectra. Before we get too
deeply involved with some examples, I want to offer some advice and a warning to the student.
Probably the single most important fact for the student to keep in mind is that not all compounds can be
uniquely identified based solely upon the mass spectrum. Quite often, when an analyst is asked to
determine the identity of an unknown compound, several complementary techniques will be used.
These techniques include infrared spectroscopy (to identify principal functional groups), proton and
carbon NMR (to identify chemically identical hydrogens and to determine connectivity in the carbon
skeleton), mass spectrometry (for molecular weight, elemental composition and molecular formula), Xray crystallography, ultraviolet spectroscopy and a variety of classical wet-chemical techniques
including melting point and boiling point determinations, refractive index, density etc.
The best way to approach any type of spectral interpretation problem is with a completely open mind.
The analyst must be willing to be led by the data provided without trying to force the spectrum to match
preconceived notions of the compound's identity. Successful interpretation involves considering all of
the data available, including the identity of reactants and known chemical conditions and reactions.
It is always best to approach the interpretation of spectra using a logical and systematic method. The
procedure we will follow includes the following steps:
1. Perform a general inspection of the spectrum. Does it have many lines (indicating the presence of
many easily broken bonds) or does it have relatively few lines (indicating very stable ions)?
2. Inspect the spectrum for the presence or absence of any A + 2 elements (Cl, Br, Si or S). From this
inspection determine the number and kind(s) of A + 2 elements present.
3. Identify the highest m/z fragment in the spectrum discounting the presence of isotope satellites. Is the
m/z of the suspected molecular ion odd or even? If it is odd, and if it is the molecular ion, then the
presence of an odd number of nitrogen atoms is indicated. Remember that the vast majority of organic
compounds will have even values of m/z for the molecular ion. Insert the appropriate error limits
(discussed below). From the A + 1 line, calculate the number of carbons present.
4. From the information provided in steps 1-3, write all possible molecular formulae.
/>
29/09/2003
Document
www.pdfgrip.com
Página 1 de 2
Page 10
5. Determine whether or not the fragment with the highest m/z is an odd-electron fragment. Only oddelectron ions can be considered as potential molecular ions.
6. Identify the presence of any other significant odd-electron ions. If the molecular ion has an even
mass, significant odd-electron ions will also have an even mass. If the molecular ion has an odd mass,
significant odd-electron ions will also have an odd mass.
7. Using the isotopic ratio, calculate the formulae for the significant odd-electron fragments and
determine their saturation index. You should also calculate the formulae and the saturation index for
significant even-electron fragments, although in many cases this is not absolutely necessary.
8. Using all of the available information from the spectrum, plus any information from other spectral
methods or from chemical and physical tests of the unknown compound, determine a structure for the
unknown compound consistent with the data available.
The mass spectra of organic compounds can be relatively simple, containing only a few lines, or
amazingly complicated, with dozens of lines. Fortunately, not every line in a spectrum has to be traced
to a particular fragment ion. This is neither desirable nor in most cases possible. As you gain experience
with interpreting mass spectra you will learn which lines are important and which lines are less
important. As a general guide, you will want to identify the molecular ion (if present), the base peak
(which is the most intense line in the spectrum), any odd-electron ions that are not the molecular ion
and any other relatively intense peaks present.
We will now look at some examples in order to demonstrate and expand upon the steps given above,
specifically steps 2-5. In these examples we will concentrate predominantly on the identification of the
molecular ion peak (or at least a peak which could be the molecular ion).
Unknown No. 1
Unknown No. 1 exhibits the following spectral abundances:
m/z
Relative abundance
64
100.0
65
0.9
66
5.0
In order to reflect normal instrumental variations, we need to include error limits in our measurements
of relative abundance. Normal error limits are either ± 10% relative or ± 0.20 absolute (whichever is the
larger).
Inserting these error limits, we see:
m/z
64
Relative abundance
100.0
65
0.9 ± 0.20
66
5.0 ± 0.5
29/09/2003
Document
www.pdfgrip.com
Página 2 de 2
This A + 2 pattern indicates that one sulfur atom could be present in the molecule. The pattern is
inconsistent with the presence of Si, Cl or Br.
29/09/2003