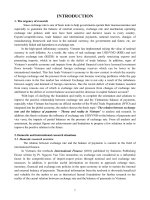
INTERNATIONAL FINANCE COURSE ASSIGNMENT the following table shows vietnam’s balance of payments in 2009, when the economy was seriously affected by the global economic recession
Bạn đang xem bản rút gọn của tài liệu. Xem và tải ngay bản đầy đủ của tài liệu tại đây (341.16 KB, 15 trang )
University of Economics and Business
Vietnam National University
INTERNATIONAL FINANCE- COURSE ASSIGNMENT
Lecturers: Mr. Nguyễn Tiến Dũng, Mr. Lê Minh Tuấn
Student’s name: Khổng Gia Tường
Date of birth: 12/01/2000
Student’s ID: 18050978
Class Code: International Finance INE3003-E
Hanoi, 2021
1
download by :
End-of-Semester Assignment
Problem 1: the following table shows Vietnam’s balance of payments in 2009, when
the economy was seriously affected by the global economic recession (maximum
2000 words, including figures or tables).
Table: Vietnam’s International Transactions, 2009 (Unit: billions U.S. dollars)
A. Current account
balance
Trade in goods
Exports, f.o.b.
Imports, f.o.b.
Trade in services
Exports
Imports
Investment incomes
Receipts
Payments
Unilateral transfers
Private (net)
Official (net)
Source: IMF Staff Report
a. Calculate Vietnam’s current account balance, financial and capital account balance,
t official settlement balance (or the balance of payment in short), and the changes in
the official reserve assets. Explain your calculations.
+)Current Account balance = (Export -Import) + Investment Income + Unilateral transfers
= (57.1 + 5.8 – 64.7 – 8.2 ) + ( 0.8 – 3.8 ) + (6 +0.4) = -6.6
2
download by :
+)Capital and Finanical Account = Direct Investment + Porfolio investment + Medium
and long-term loans + Short-term capital
= 6.9 - 0.1 + 4.4 – 4.5 = 6.7
+)Balance of payment = Errors and omission + Current Account balance +
Capital and Finanical Account
= -9 – 6.6 + 6.7 = -8.9
+)Changes in international reserve = - Balance of payment
= 8.9
b.
Based on the economic situation in 2009, discuss the disequilibrium (surplus
or deficits) in the current account balance, financial account balance, and the
balance of payment.
- After the world crisis in 2009, the US is still the leading nation drawing in capital
inflows within the world, net capital inflows into the US have remained positive for
numerous successive a long time, whereas net capital inflows into other nations have
remained positive. Developing countries are reliably negative, and net capital streams to
EU nations are more unstable, with positive and negative for a long time. Vietnam is one
of the developing economies that's emphatically affected over all macroeconomic pointers.
In 2009, Vietnam's yearly GDP development rate was abating down from 7.5% in 2007 to
about 6% in 2008 and after that 5.3% in 2009, sometime recently recuperating
3
download by :
to 6.10% in the final year 2010. Trade development to the European Union, the primary
showcase for the United States, has fallen from 60% to -30%, agreeing to the IMF, 2010.
Inflation is additionally an disturbing issue, the level of the yearly increment within the the
annual increase in the consumer price index 28% in September 2008 and increased to 65%
for food (rice and cereals).
-
Current account shortfall (agreeing to the spreadsheet) reasons:
+ Import and export value of goods and services: Total export turnover in 2009 reached
about 56.5 billion USD, down 9.9% compared to 2008. Total import turnover in 2009 was
estimated at 68.8 billion USD, down 16.4% compared to 2008. Although both export and
import turnover decreased, because the decrease in export turnover was slower than import
turnover, the trade deficit in 2009 decreased to only about 11 billion USD, accounting for
16.5%. total exports.
+ Primary income:
Vietnam's total investment income: Vietnam's investment income is mainly the interest on
deposits of Vietnamese residents in foreign banks and it decreases because we withdraw
foreign currency. domestic lending.
Total payments for investment in Vietnam: payables are increasing due to interest
payments on foreign debts. Many FDI enterprises, branches of foreign companies tend to
remit profits back home to support the parent company, increasing expenditures in the
service balance. Vietnam's income continues to have a higher deficit than in 2007 and
previous years.
+ Secondary income: In Vietnam's current transfer balance, the part that accounts for the
majority is private transfers, while the government transfer portion accounts for a
negligible proportion and tends to be stable. The establishment of new money transfer
channels has helped overseas Vietnamese feel secure in transferring money through
official channels and helps reduce remittance costs and risks. The policy of attracting
4
download by :
remittances allows Vietnamese people to directly bring money back home without limiting
the quantity, just declaring the customs, allowing overseas Vietnamese to buy houses or
invest in Vietnam... Remittances have been repatriated in recent years, causing Vietnam's
private transfers to increase unceasingly, so that the Government has partially offset the
current account deficit.
Vietnam's current account deficit is partly due to the state budget deficit. The high budget
deficit (in 2009: 6.9% of GDP) plus the public debt (and secured public debt) increasing to
45% of GDP is a testament to Vietnam's growing current account deficit.
- FA surplus:
+ Direct Investment (FDI):
According to the Foreign Investment Agency, disbursed FDI in 2009 was about 10,000
million USD, equaling 89.6% over the same period in 2008. In 2009, the United States
was the largest investor with a total registered capital of 9,800 million USD (accounting
for 45% of total FDI capital into Vietnam). Coming in second is the Cayman Islands,
followed by Samoa and South Korea. Accommodation and catering services are at the top
with 8,800 million USD. Next is the real estate sector with 7,600 million USD.
Investment capital from the non-state sector and FDI dropped sharply in the first quarter to
only 12.7% and 6.2% of GDP compared to 16.5% and 13.0% of GDP in 2008. However, ,
investment capital from the state sector increased quite strongly (to 18% of GDP), which
largely offset the decrease in investment capital from other sectors, helping the total
investment capital of the whole society still account for a proportion of 37.4% of GDP.
Entering the second quarter, social investment has increased to 44.1% of GDP. Entering
the third and fourth quarters, investment capital from the FDI and non-state sectors has
increased strongly as a percentage of GDP, returning to the high level of 2007-2008, even
compensating for the decrease in investment capital. from the public sector to GDP
(reduced to only 14.9% of GDP).
5
download by :
+ Foreign debt + ODA:
In 2009, the country's total foreign debt balance (including government external debt and
government-guaranteed foreign debt) was 27.93 billion USD.
In 2009, the total amount of quick disbursement in the form of state budget support
reached over 1.84 billion USD
-> BOP deficit
c.
How did the State Bank of Vietnam (SBV) respond to this situation through
exchange rate policy and foreign exchange market intervention? Show that the SBV
actually moved to a more flexible exchange rate policy during this period.
Exchange rate policy
+ 1955 - 1989: Multi-exchange rate regime
+ 1989 - 1991: Single exchange rate regime, adjusted for signals of inflation, interest
rate,
BOP
+ 1991 - 1999: Fixed the official exchange rate on the basis of bidding at 2 foreign
currency trading centers, limiting the exchange rate band
+ 1999 – present: Announcement of average interbank exchange rate, limit of exchange
rate band
Within the period of 2008 - 2009, the worldwide financial and money related emergency
caused numerous impacts on the outside trade showcase in Vietnam, the State Bank of
Vietnam presented a number of measures to reply, the tightening monetary policy was
moved to cautiously loosening monetary policy:
+ The State Bank immediately announced to import gold to reduce pressure on gold
supply; thereby, reducing the heat of the dollar on the free market.
6
download by :
+ Buying and selling foreign currencies: The exchange rate on the free market
continuously increased sharply, the foreign currency trading activity on the free market
was the hottest ever, in mid-November, the exchange rate was adjusted hourly.
+ Strengthening measures to shock foreign exchange
The global economic crisis has affected the exchange rate in the market. An import
demand shock causes output to fall.
Exchange rate, E
DD2
3
E1
Y3
We have the DD-AA model in the situation of flexible and fixed exchange rate policy
- In the status of using flexible exchange rate policy:
In 2009, during the global economic crisis, the impact on Vietnam caused export demand
to decrease, leading to a decrease in domestic output. The chart above uses the DD - AA
model to look at market volatility by comparing the response of the Vietnamese economy
with fixed and floating exchange rates to reduced export demand. . Falling demand for
Vietnamese exports reduces aggregate demand at all exchange rates, E, thereby shifting
the DD curve to the left from position DD1 to position DD2.
7
download by :
The short-run equivalent equilibrium of the economy is at point 2; relative to the initial
equilibrium at point 1, the domestic currency depreciates (E increases) and domestic
output decreases.
- In the status of using the fixed exchange rate policy:
When there is a demand shock that causes the demand for exports to decrease, the Central
Bank buys domestic money with foreign exchange reserves, causing AA to move from
position AA1 to position AA2.
Using a fixed exchange rate policy decreases more sharply than output when using a
floating exchange rate policy.
By looking at the case of the global financial crisis, a global shock causes export demand
to fall in the short term. The drop in demand for exports as shown in chart b, if it occurs
over a long period of time, will lead to a "fundamental imbalance" and we can see that the
adoption of a flexible exchange rate policy helped the economy mitigate the negative
impacts of the global recession.
d. Using the DD-AA model, show that the adoption of a more flexible exchange rate
policy assisted the economy in mitigating the adverse effects of the global economic
recession. (Hint: you should compare the effects of the global economic recession and
the resulting fall in the aggregate demand under fixed and flexible exchange rates)
8
download by :
Exchange rate, E
DD
E2
2
E1
1
AA1
Y1
Y2
AA2
Output, Y
At the initial output level Y1 and given the fixed price level, an increase in money supply
must push down the home interest rate, R
An increased money supply shifts AA1 upward to AA2 but does not affect the position of
DD. The upward shift of the asset market equilibrium schedule moves the economy from
point 1, with exchange rate E2 and output Y2. An increase in the money supply causes a
depreciation of the domestic currency, an expansion of output, and therefore an increase in
employment.
We have been assuming that the monetary change in temporary and does not affect the
expected future exchange rate Ee. In order to preserve the interest parity in the face of a
declince in R ( given that the foreign interest rate, R* does not change ), the exchange rate
must depreciate immediately to create the expectation that the home currency will
appreciate in the future at a faster rate than what expected before R fell. The immediate
depreciation of the domestic currency, however, makes home products cheaper relatively
to foreign products. There is also an increase in the aggerate demand, which must be
matched by an increase in output.
9
download by :
Problem 2: The following table shows the inflation rates in the U.S. and European
countries at the end of 1960s and the early 1970s (maximum 2000 words).
Country
Britain
France
Germany
Italy
United States
Source: OECD
a.
Discuss the trend in the inflation rates between the U.S. and European
countries during this period.
The table illustrates changes in the inflation rate between the U.S and European countries
from 1966 to 1972. In the first 3 years, Britain and Germany witnessed a fluctuation in
the inflation rate with a drop in 1967 and then a recovery in the next year. In contrast,
France and Italy remained their inflation rate in 1967, however France’s rate nearly
doubled in 1968 whilst Italy witnessed a fall from 2.1% to 1.2%. The U.S’ rate increased
gradually from 2.9% to 4.2% during this period.
10
download by :
In the next 4 years, Britain’s kept on its upward trend, reached 9.7% in 1971, the highest
rate among those nations, but then this rate suddenly dropped to 6.9% in the last year of
the period. Italy’s inflation rate also followed a stable increasing course after a significant
increase to 2.8% in 1969. Germany’s inflation ratio dropped nearly 1% to 1.9% - the
lowest of 1969 then it followed an upward trend, finished at 5.5% in 1972. France
however went through an unstable period with the inflation ratio, stood at 6.2% in 1972.
America’s rate reached its peak in 1970 and then reached the bottom in 197 with the
lowest inflation rate of the 5 countries.
b. Explain why, with the exception of the U.S., monetary policies were ineffective
under the Bretton-Woods fixed exchange rate system. (Hint: you should use the DDAA diagram for this question).
The Bretton Woods framework bound together settled rates for major monetary standards
and permitted central banks to mediate within the cash markets. The Bretton Woods
administration stipulates that one ounce of gold costs $35. In the Bretton–Woods
framework, central banks stay autonomous through capital controls. In any case, capital
markets have gotten to be progressively interconnected, particularly since the late 1950s,
so the ability for central banks within the European Union to proceed to actualize free
financial approach is exceptionally restricted.
The US has an independent and effective monetary policy
For example, we have the DD - AA model in the UK using a fixed exchange rate:
DD1
11
DD2
download by :
AA2
AA1
Y1
Y2
Y3
European nations counting the US are working their currency markets beneath the Bretton
Woods framework, which binds together a settled rate for major currencies and permits
central banks to intercede within the currency markets. Subsequently, when European
nations increment the money supply, due to the fixed exchange rate, currency interest rates
diminish, putting weight on the domestic money to devalue. To be able to adjust the
exchange rate, keep interest rates settled and prevent currency devaluation, European
governments had to offer foreign currency to other nations.
However, selling foreign currency reduces the money supply, causing the AA curve to
shift to the left. Because the AA curve is left-shifted, there is no effect on output growth or
employment growth.
Other than, when the currencies of European countries devalue, the exchange rate between
the EU/USD falls, driving to a diminish in equilibrium output, the DD curve shifts to the
left. Usually chosen as one of the reasons why financial arrangement in European nations
isn't viable beneath the Bretton Woods fixed exchange rate framework.
12
download by :
c. Explain the observed close relation between the inflation rates in the U.S. and
European countries. Use the diagram of internal balance and external balance to
support your arguments.
The European economies are coming to both internal and external balance at point 1, where
yield is calculated by the equation: Q= E x P*/P. However, when inflation within the US
increments as the US starts to extend the money supply, P* increases again. And presently
at that time, the European nations were within the Bretton Woods framework, so the
exchange rate E was settled. From this it can be seen that an increase in Q* output makes
domestic products competitive. Domestic goods compete for stick in a straight line and
move down the stream, meeting each other to form a new equilibrium 2.
13
download by :
In fact, the economies of European countries have not yet moved from equilibrium point
1. At equilibrium point 1, according to the Four Economic Difficult Zones, point 1 can be
considered as being in the first quadrant of the economy. line and, ie on lines and. For that
reason, in the short run, domestic output is larger than potential output, leading to an
excessive balance of payments surplus.
Other than, within the long term, domestic prices change due to domestic output being
larger than potential output, inputs being over-exploited. As a result, input costs expanded
strongly, costs increased, and product costs in European nations taken after the same drift,
driving to an increment in inflation in these countries. But according to the equation, when
P * increases but P also increments, Q remains unchanged, line XX and line YY remain
unchanged, returning to the initial 1 position. However, inflation has happened, which is
what causes inflation within the US to cause “inflation imports” for other nations.
14
download by :