Tài liệu ESPON 2013 DATABASE FIRST INTERIM REPORT pptx
Bạn đang xem bản rút gọn của tài liệu. Xem và tải ngay bản đầy đủ của tài liệu tại đây (4.7 MB, 162 trang )
ESPON 2013 DATABASE – First Interim Report – 2009 February 27
1
ESPON 2013 DATABASE
FIRST INTERIM REPORT
2009 February 27
This first interim report represents the first
results of a research project conducted within
the framework of the ESPON 2013
programme, partly financed through the
INTERREG III ESPON 2013 programme.
The partnership behind the ESPON Programme
consists of the EU Commission and the
Member States of the EU25, plus Norway,
Switzerland, Iceland and Liechteinstein. Each
country and the Commission are represented
in the ESPON Monitoring Committee.
This report does not necessarily reflect the
opinion of the members of the Monitoring
Committee.
Information on the ESPON Programme and
projects can be found on www.espon.eu
The web site provides the possibility to
download and examine the most recent
document produced by finalised and ongoing
ESPON projects.
ISBN number:
This basic report exists only in an electronic
version.
Word version:
© The ESPON Monitoring Committee and the
partners of the projects mentioned.
Printing, reproduction or quotation is
authorized provided the source is
acknowledged and a copy is forwarded to the
ESPON Coordination Unit in Luxembourg.
ESPON 2013 DATABASE – First Interim Report – 2009 February 27
3
List of contributors to the first interim report
UMS RIATE (FR)
Claude Grasland*
Ben Rebah Maher
Ronan Ysebaert
Christine Zanin
Nicolas Lambert
Bernard Corminboeuf
Chloe Didelon
LIG (FR)
Jérôme Gensel*
Bogdan Moisuc
Christine Plumejeaud
Marlène Villanova-Oliver
UAB (ES)
Andreas Littkopf
Juan Arevalo
Roger Milego
IGEAT (BE)
Moritz Lennert
Didier Peeters
UMR Géographie-cités (FR)
Anne Bretagnolle
Hélène Mathian
Joël Boulier
Timothée Giraud
Marianne Guerois
TIGRIS (RO)
Octavian Groza
Alexandru Rusu
Université du Luxembourg (LU)
Geoffrey Caruso
National University of Ireland (IE)**
Martin Charlton
Paul Harris
National Technical University of Athens
(GR)**
Minas Angelidis
Umeå University (SE)**
Einar Holm
Magnus Strömgren
UNEP/GRID (CH)**
Hy Dao
Andrea De Bono
* Scientific coordinators of the project
** Experts
TABLE OF CONTENT
1.1 EXPECTED CONTENT (LEGAL OBLIGATIONS) 8
1.2 CLARIFICATIONS OF ESPON DB’S OBJECTIVES 10
2 REVIEW OF THE CHALLENGES 14
2.1 CHALLENGE 1: COLLECTION OF BASIC REGIONAL DATA 14
2.2 CHALLENGE 2: HARMONIZATION OF TIME SERIES 19
2.3 CHALLENGE 3: WORLD / REGIONAL DATA 25
2.4 CHALLENGE 4: REGIONAL / LOCAL DATA 31
2.5 CHALLENGE 5: SOCIAL / ENVIRONMENTAL DATA 34
2.6 CHALLENGE 6: URBAN DATA 39
2.7 CHALLENGE 7: EXTRA-ESPON DATA EXCHANGE 44
2.8 CHALLENGE 8: INTRA-ESPON DATA EXCHANGE 48
2.9 CHALLENGE 9: DATA MODEL AND INTEGRATION 58
2.10 CHALLENGE 10: SPATIAL ANALYSIS FOR QUALITY CONTROL 69
2.11 CHALLENGE 11: ENLARGEMENT TO NEIGHBOURHOOD 73
2.12 CHALLENGE 12: INDIVIDUAL DATA AND SURVEYS 75
3 TRANSVERSAL QUESTIONS 78
3.1 NEW VERSION OF THE MAP KIT TOOL 78
3.2 DATA AND METADATA 85
4 CONCLUSION 109
4.1 SYNTHESIS OF PROGRESS MADE 109
4.2 WORKPLAN UNTIL SIR 111
4.3 ESPON DB AND ESPON PROJECT PRIORITIES 113
5 ANNEXES 115
ESPON 2013 DATABASE – First Interim Report – 2009 February 27
6
Organisation of the first interim report
At first, and after consultation with the ESPON Coordination Unit (CU), the aim was to
produce a short report (max. 60) where only major information is reported and where
details that are not of prime interest are rejected to different annexes. But we deceided
to overcome this limit for 2 reasons: (1) inclusion of illustrations making the document
more attractive. (2) in depth discussion of important cross-challenge topics like
metadata and map-kit tool.
The aim of the first interim Report (Part 1) is an introduction where we precise the
legal expectations to be fulfilled by the project and to addresse the specific request
made by the ESPON CU after the delivery of the first Interim Report (1.1). It also
describes what are the most important evolutions of the project that have been
decided since the inception report in order to reach the objectives and answer to
ESPON CU requests (1.2).
The review of challenges (Part 2) is the core part of the report that provides
synthetic information on the work done so far. Each challenge is organised in the same
way (objectives, results, difficulties, workplan) and can be read independently.
Connexions between challenges are clearly identified and help the reader to navigate
between each of them
1
. A first group of challenges is related to the production of
specific datasets or specific expertise on different types of geographical objects:
collection of basic data at regional level (2.1), harmonisation of time series (2.2),
enlargement of regional data toward global (2.3) or local (2.4) levels, combination of
social and environmental data (2.5), and collection of urban data (2.6). A second group
of challenges is more closely srelated to data flows, both external (2.7) and internal
(2.8), with the target of production of an integrated data model that can be
implemented as a computer application (2.9). The involvement of the expert team is
related to the specific description of new challenges that are related to spatial analysis
tools for quality control (2.10), collection of data on neighbouring countries (2.11) and
exploration of individual data and surveys (2.12).
The transversal questions (Part 3) are related to specific deliveries of the project
like the ESPON Mapkit tool (3.1) or to questions of common interest that involves all
partner teams, like the elaboration of a common strategy for metadata (3.2).
The conclusion (Part 4) defines firstly the agenda of the project for the next period
of 12 months until second interim report in February 2010. Special attention is paid to
the ESPON seminars of Prague (June 2009) and Sweden (December 2009) that are
crucial milestones for the publication or the dissemination of new results. It proposes
1
Due to contractual obligation, the report has to be delivered in paper format, but an HTML file
would be more convenient for an easier “navigation” between challenges.
ESPON 2013 DATABASE – First Interim Report – 2009 February 27
7
some synthetic tables of objectives and deliverables and addresses finally some specific
questions to the ESPON CU.
The Annexes (Part 5) provides more details on specific topics.
ESPON 2013 DATABASE – First Interim Report – 2009 February 27
8
1 Aim of the first interim report
1.1 Expected content (legal obligations)
The content of the first interim report is firstly delineated by the legal obligations
defined in the Subsidy Contract (SC) and the Response on Inception Report (RI) sent
by ESPON CU the 24 October 2008. This points are quoted below as SC1 to SC5 and
RI1 to RI7
February 2009 (1st Interim Report)
[SC1] Presentation of the results of the test to be undertaken within the ESPON
community in order to assess the database compliance with the objectives initially
defined and its user friendliness towards researchers, policy makers and practitioners
working at different geographical levels. (cf. point V, 3).
[SC2] Delivery of a consolidated version of the ESPON 2013 Database (internal and
public versions) and of a compatible ESPON map kit tool, taking also in consideration
the results of the test and evaluation stage (cf. point V, 3).
[SC3] Presentation of a timetable for regular updating and ESPON 2013 Database,
including statistical validation of data sets delivered by other ESPON projects, updating
of data and indicators, delivery of data for ESPON publications and possible update or
adjustments of the ESPON map-kit tool.
[SC4] Short reporting of the networking activities, both planned and realised, at
internal (with ESPON 2013 projects) and external level (with European and
international organisations with relevant data for ESPON).
[SC5] Work plan until 2nd Interim Report.
Points to be improved during the project implementation and to be addressed in the
First Interim Report
[RI1] Presentation of an overall work plan including a more detailed overview on the
activities and the expert teams involved, as well as the respective timetable.
[RI2] On challenge 1 (page 12-14). The Lead Partner is requested to precise the list of
indicators considered as “basic indicators”. In addition, the Lead Partner is asked to
present the current situation of the ESPON 2006 database and define immediate needs
for updating (cf. annex III to the contract, point k)
ESPON 2013 DATABASE – First Interim Report – 2009 February 27
9
[RI3] On challenge 3 (page 16). The Lead Partner is considering improving the WUTS
System provided by ESPON 2006 project 3.4.1 – Europe in the world. It is important to
mention that it is envisaged in the near future to open a call for an ESPON project
dealing with the world scale. Therefore, the Lead Partner of the ESPON database is
requested to take this information into consideration and to cooperate with this project
in order to avoid an overlap of work.
[RI4] With regard to challenge 5 (page 18), the Lead Partner is asked to better
explain it. The objectives are not given; the cooperation envisaged between ESPON
and EEA is not clear, in particular the practical meaning of the following sentence
needs to be clarified: “Therefore, the problem is not to duplicate the work realised by
EEA but to introduce a flow of data exchange between ESPON and EEA and to build
common data infrastructure in order to ensure full compatibility of database on each
side”.
[RI5] Challenge 6 (page 19-20). The construction of complex geographical objects of
higher level is aimed. This challenge is explained using cities. No other examples are
mentioned. Considering the time frame and the complexity of the object “cities”, it is
suggest that this challenge will be focussed only on cities.
[RI6] Challenge 7 (page 21), it would be important to have a more concrete idea on
the networking activities to be developed with the different organisations mentioned.
In addition, the repartition of tasks between UMR RIATE and UL should be made
clearer.
[RI7] Challenge 9 (page 34). It should better describe. It has no name, no objective,
no timetable.
[RI8] Components of the application ( page 31)
i. The description of the import pool seems too ambitious. Please check that all the
verifications mentioned for importing data will really be undertaken.
ii. On page 33 it reads: “In order to overcome these issues, a simplified database
will be set up in the more advanced stages of the project”. What do you mean with
“simplified version” and with “advanced stages of the project”? Please be aware that a
public version of the ESPON database should already be delivered by November 2008.
iii. In addition and according to the project specification, the Lead Partner should
ensure “usability” to the ESPON 2013 Database. In particular “the application should
be user-friendly and make the users understand which data is available”. In particular
for “non-experts” on data issues.
iv. In relation to the hosting of the application and management of the server
resources, the Lead Partner is requested to consider the following: The ESPON
Programme will host the application developed in all stages of the project and access to
the ESPON 2013 database will only be given through the ESPON website (public
database) and the ESPON intranet (internal database). In relation to this issue, the
Lead Partner is requested to comply with point f) of the Annex III to the contract,
ESPON 2013 DATABASE – First Interim Report – 2009 February 27
10
which says: “the project will provide, as soon as possible, a more detailed technical
description of the requirements for hosting the database. Furthermore, the project will
describe, in the inception report, a procedure with a time table to keep the database on
the ESPON server up to date”.
1.2 Clarifications of ESPON DB’s objectives
An internal meeting has been organised in Paris the 2-3 Feb. 2008 with all the project
partners and the expert teams, in order to summarize the results of the work done so
far, to prepare efficiently the First Interim Report (FIR) and to organize the work for
the next 12 months until the Second Interim Report (SIR). The ESPON seminar of
Bordeaux in December 2008 has been a first opportunity for the project partners of
ESPON DB to meet each other and to exchange with the other ESPON projects under
Priority 1 and Priority 2. In this section, we summarize the main conclusions of the
internal meeting and the way they have contributed to clarify the orientations of the
project and to provide answers to the questions to be addressed in the FIR (see. 1.1).
1.2.1 An internal organisation by challenge
The presentation of the results of ESPON DB project by challenge (Bordeaux Seminar,
Paris meeting) has proven to be very efficient. It gives a clear idea of results of the
test phase in order to assess the database compliance with the objectives initially
defined and its user friendliness towards researchers, policy makers and practitioners
working at different geographical levels [SC1]. As each project partner is responsible
for at less one challenge, its contribution is more visible and the internal and external
networking of the ESPON DB project is more visible and efficient [SC4]. Moreover, it is
easier to define the workplan and the objectives of the project for the next period
[SC5] because each project partner has to identify the contributions and deliverables
that are under its direct responsibility. It is also easier to provide answers to request of
clarifications addressed by ESPON CU to specific challenges [RI2, RI3, RI4, RI5, RI6,
RI7].
One possible danger of this organisation by challenge could be a lack of integration of
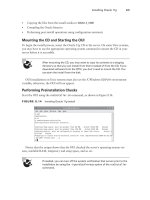
results at project level. But it is not the case because the internal seminars but also the
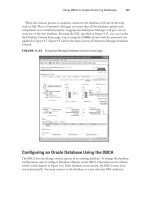
Extranet (opened in Feb. 2009, see Figure 1) give to partners the opportunity to
exchange their discoveries and to identify connexions and areas of common work
between challenges (as shown in Figure 2).
ESPON 2013 DATABASE – First Interim Report – 2009 February 27
11
Figure 1 - The Extranet of the ESPON DB project (Feb. 2009)
Figure 2 - Example of challenges’ networking (Feb. 2009)
1.2.2 Two types of deliverables : Indicators and Technical Report
Since the meeting in Paris, some clarification has been made about what can be
delivered by the ESPON DB project to the ESPON community and to external world.
Until the Paris meeting, it was admitted that deliverables were mainly “databases” with
different components (statistical information, geometries, computer application for data
management).
ESPON 2013 DATABASE – First Interim Report – 2009 February 27
12
More precisely, it was admitted that one indicator of performance of the project ESPON
DB should be the elaboration of “indicators”, but this word was relatively unclear as it
can cover different meanings. For some researchers, “indicators” can be understood as
an opposition between “raw count data” (e.g. population, GDP, area, …) and “relative
measure of intensity” (e.g. population density, GDP per capita, …) that can be used for
the measure of territorial units of different sizes. But we can object to this point of view
that size criteria like population and GDP can be sometimes precious criteria for the
evaluation of regional trends. Another point of view could be to consider “indicators” as
new data elaborated by an organization, that were not previously available or that
have undergone some transformation resulting in a clear added value. It is clearly the
semantic point of view of OECD that publishes datasets of “regional statistics and
indicators”. These data are generally derived from national or international agencies,
but their added value is related to the harmonization done by OECD, in particular
through the definition of harmonized regional levels. If we adopt this point of view, an
ESPON indicator could be defined as “an integrated set of statistical data
and
geometries
harmonized by ESPON, documented by metadata, with a clear
added value as compared to initial informations”.
But it was also clear that the deliverables of the project ESPON DB can not be limited
to “data” and are also related to the “Know how” of how to integrate data (Figure 3).
That is the reason why an important decision of the Paris meeting was to launch a
collection of ESPON DB Technical Reports that describe how to solve specific
problems of data integration that can not be fully explained in the very brief
description that are usually given in metadata files. In the elaboration of a timetable
for regular updating of the ESPON database [SC3] and in the definition of the
Workplan [WP4], we have clearly introduced the delivery of Technical Reports as
important milestones (see conclusion 4.2).
Figure 3 - The two types of deliverables of ESPON DB project
1.2.3 Dataflows and metadata
In the inception report as in the presentation of the ESPON DB project made at the
ESPON seminar in Bordeaux, the CU pointed some ambiguities in the definition of the
so-called “Internal” and “External” database [SC2, RI8]. More generally, the question
of metadata was considered as crucial, both for input in the ESPON database (from
other ESPON projects, other organisation) and for output (toward other ESPON
ESPON 2013 DATABASE – First Interim Report – 2009 February 27
13
projects, other organisations) and it appeared urgent to provide strong guidelines on
this issue [SC4, RI6].
The distinction between “Internal” and “External” database was clarified by ESPON CU
that explained during the Paris meeting that the distinction between the two databases
is firstly related to copyright issue. The external data are the one that are not
protected by copyright and can be therefore disseminated out of the ESPON
community. At the same time, it appeared also that the content of the “External”
database can be considered as an ESPON publication, subject to quality control and a
form of official stamp as it engages the collective responsibility and the reputation of
the ESPON program. The metadata that are related to external publications of ESPON
data should be therefore extremely precise and fully INSPIRE compliant, in order to
make possible their dissemination. On the basis of this discussion, it was decided that
external database should be based, in the initial period, on the publication of fixed
tables and not on an interactive computer application where users can download data
without any pre-definite form. The interactive consultation of data stored in the ESPON
Database will define the “Internal database” where the access is limited to ESPON
members.
Based on the need of the final users (internal and external databases) we have
redesigned the organisation of dataflow (see Figure 4) and launch a working group on
metadata that has provided efficient guidelines for integration of new data in the
ESPON database, either from external organisation or from other ESPON projects. In
order to test the efficiency of this rules for metadata and data checks, we have decided
that each responsible of challenges 1 to 6 will introduce himself a set of basic data in
order to provide models of each type (regional, world, local, cities, grid) for other
ESPON projects.
Figure 4 - Overview of data flows
RIATE
LIG
IMPORT
EXPORT
1
2
3
12
…
DATA providers
- Internal ESPON projects
- Externals : OECD, UN,
Eurostat, UNEP-grid, …
Export data
ESPON 2013 DB
MEGABASE
ESPON
DATABASE
COLLECT DATA
AND METADATA
CHECK, COMPLETE, ENRICH METADATA AND
DATA
EXPORT DATA WITH
METADATA
Web
Discover data by metadata : query
by objects, scale, thematic
Identify user’s access right
ESPON 2013 DATABASE – First Interim Report – 2009 February 27
14
2 Review of the challenges
2.1 Challenge 1: Collection of basic regional data
Coordinator: RIATE
Delivery of basic datasets derived from EUROSTAT and EEA at NUTS2 and
NUTS3 levels according to NUTS2003 and NUTS2006 divisions.
2.1.1 Objectives
The production of harmonized datasets covering all the ESPON space (31 countries) at
NUTS 2 or NUTS 3 level has been recognized as the first challenge to be solved with an
absolute priority as it is a condition of continuity with previous work realized in ESPON
2006 program. It is obvious that the new ESPON 2013 project needs immediately basic
information at this level like area, population, GDP, employment, which will be used as
reference for more sophisticated analysis where these projects will produce more
precise information in their specific fields. Moreover, the map kit tool that will be sent
to these projects (see. Section 4) should not be limited to purely geometric information
and should involved this basic data sets as starting point and model for more
elaborated data collections. Finally, we should be able in a short delay to connect the
new information elaborated by ESPON 2013 Program with former datasets elaborated
by ESPON 2006 Program in order to produce time series of indicator, with the objective
to support projects on the monitoring of European territory.
2.1.2 Work done
The data collection has begun in the NUTS 2003 version, where the data availability
was the most important thanks to last downloads from Eurostat centralized at UMS
RIATE and the previous ESPON database. Some basic indicators have been collected:
GDP, population, area, unemployment, active population and land use in 2003. The
collection of this information has made it possible to compute them in order to develop
some basic ratios: GDP per inhabitant, population density, unemployment rate etc. The
variety of the sources existing concerning NUTS 2003 version allows having a good
quality of completeness of data (fig. 5).
ESPON 2013 DATABASE – First Interim Report – 2009 February 27
15
Figure 5 - Degree of completeness of the indicators collected in NUTS 2003 version
The next step of the work has been to extend the data collection at NUTS 2006
version. Three main ways have been investigated:
A) Download on Eurostat of the same basic indicators (GDP, Unemployment, area) and
its evolution on a time-period of 5 years (2000-2005 or 2006).
B) Try to have a complete dataset from NUTS3 to NUTS0 for total population 2000-
2006. It implies to overcome the problem of missing values and making some data
estimations.
C) Check and integration of data from ESPON Territorial Observation No.1 with
computing the results obtained at different NUTS level.
A) The idea of the download of the basic indicators was to follow and extend the
previous integration in NUTS3 division. Follow, because the same stock indicators were
uploaded and extended considering that it was tried to make possible the calculation of
evolution. No estimations have been implemented here (except for land use); i.e. the
table down (Figure 6) is a sum up of the availability of the data on Eurostat website in
February 2009. The fact is that it is very difficult to have complete dataset for these
indicators for the moment.
Figure 6 - Degree of completeness of the indicators collected in NUTS 2006 version.
B) The Eurostat data on population development (2000-2006) were lacking in some
cases (DK, UK, PL…), namely at NUTS2 and NUTS3 level. On top of that, some values
appeared probably false (discontinuities in time series, cf annex 1). The work of the
ESPON 2013 Database project has been first to estimate missing values. Secondly, to
identify some discontinuities of values in the evolution of population for each NUTS in
order to point out some strange behaviour. In deed, the ESPON 2013 Database project
ESPON 2013 DATABASE – First Interim Report – 2009 February 27
16
proposes full dataset at NUTS3 (figure 7), NUTS23, NUTS2, NUTS1 and NUTS0 for total
population from 2000 to 2006 and has marked strange values with flags in the dataset.
Figure 7 - Evolution of population (2000-2006), NUTS3
C) The integration of data from other ESPON projects is a fundamental point for ESPON
2013 Database. That has been done with data coming from ESPON Territorial
Observation (see figure 8). The first step has consisted to check carefully data then
some mistakes have appeared (cf annexes 1). After exchanging views with the data
provider, the problems encountered has been corrected. After this, the aim has been to
re-estimate the indicators created at NUTS23 level in the other official level of NUTS:
(NUTS2, NUTS1 and NUTS 0).
ESPON 2013 DATABASE – First Interim Report – 2009 February 27
17
Figure 8 -Typology of population development at NUTS2 level
This information has been integrated in the internal database. The metadata is
described at the level of the value in order to see immediately which values are official
(Eurostat) and which values have been estimated (ESPON projects). The tables that
have been checked will be presented in the external database as a form of synthetic
tables available at different geographical scales (Figure 9).
Figure 9 - Example of diffusion table
2.1.3 Identified difficulties
Even if this challenge has tried to overcome the difficulties raised by missing values in
NUTS 2006 division for the most common indicator (total population), some questions
or problems are still not solved concerning this point:
It will be difficult to guaranty the estimations of missing values of the other basic,
indicators, because it implies both a long treatment chain and to ensure the
compatibility between the different tables (for example, if we estimate the age-pyramid
ESPON 2013 DATABASE – First Interim Report – 2009 February 27
18
of each region of ESPON space, it is important to take care of the equality of values
between the different tables).
An estimation method has been chosen for total population, based on spatial and
temporal extrapolation from a thematic point of view and on linear trends from
statistical point of view. It is not the single method which can be used.
What strategy adopting for official values which introduce mistakes in the dataset? The
annex 1 proposes some possible solutions but the answer is still open.
Then, considering the intra-ESPON data exchanges, some dangerous practices have
been noticed. In order to avoid this, it is fundamental to define a protocol of data
downloading and indicator building.
2.1.4 Work plan
In order to follow the results and problems raised by the work done, four main fields
will be tested and improved for the Second Interim Report (February 2010).
[June 2009]
Delivery of complete indicators at NUTS2 level (GDP, Population, Unemployment, …)
Continue to check and integrate dataset from other ESPON projects or expertises
(ESPON Territorial Observation No.2?)
[Dec 2009]
Integration of accessibility indicators and at least, road time distance matrix (if
received)
Try to enlarge the integration of two basic data and area - to other geographical
objects and scales: World, cities, grids (exchanges with challenges 3, 5 and 6).
[Feb 2010 ]
Try to define a methodology to detect spatial and statistical outlier in these basic
datasets to point out extraordinary values (exchanges with challenge 10)
ESPON 2013 DATABASE – First Interim Report – 2009 February 27
19
2.2 Challenge 2: Harmonization of time series
Coordinator: IGEAT
Harmonization of time series for basic socio-economic indicator at regional
level for the period 1995-2006.
2.2.1 Objectives
Based on the result of challenge 1, we propose to elaborate a methodology for the
harmonization of time series covering ESPON territory at regional level for the period
1995-2006 on the basis of simple indicators of regional policy (population, GDP,
unemployment, age structure). The problem is not to cover immediately a great
number of indicators but to define a methodology that could be implemented in the
ESPON 2013 DB and reproduced by different ESPON projects.
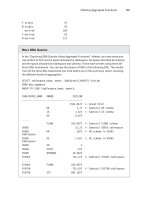
2.2.2 Work done inventory and benchmarking (expertise) of sources and
experiences
The first step of the work consisted in enumerating and collecting the different sources
that could be relevant (interest) to harmonizing temporal NUTS versions. We have also
examined some attempts to create temporal GIS of administrative boundaries’
changes. We have focused on how these projects had approached the problem of
creating-variant GIS of changing boundaries and how they storage changes.
The harmonization of NUTS geometries is based on a meticulous combination of
several sources. The most important are:
The Official Journal of the European Union is the legal source. It constitutes the
juridical framework of regulation of NUTS since 2003
2
( see annexe 2).
EUROSTAT provides the most important databases of NUTS versions
3
. It describes the
changes occuring between each version.
National statistical institutes
4
can provide historical databases of national
administrative boundaries. This source is very important to understand local changes
affecting the geometry or structure of NUTS. It is also very useful in the case of the
accessing of new countries (E15, E25, and E27) because EUROSTAT databases do not
2
/>en
3
4
ESPON 2013 DATABASE – First Interim Report – 2009 February 27
20
provide long term information about the historical administrative boundaries of these
new members.
Other projects (scientific and operational)
5
: Many countries have attempted to
construct temporal databases of their changing administrative boundaries. These
experiences can provide databases (in the case of European countries) and
methodology (Gregory I.N., 2002). The diversity of proceedings is explained by the
specificity of each case.
Based on these different sources, the ESPON Historical GIS NUTS aims to be an
innovative operational tool for providing temporal harmonized data series.
2.2.3 Identified difficulties
The Time Series issue can be divided in to three main types of problems which call for
different approaches. Fundamentally in each problematic case there is a lack of data
for a territorial unit, either because the territorial unit used has changed in the course
of time or because data are simply missing for that territorial unit. We summarize
below in this first part the three main sources of problems and the usual way to solve
them.
2.2.3.1 Changes in NUTS
The "Nomenclature of territorial units for statistics" (NUTS) established by Eurostat for
over 30 years is the official territorial subdivision system used in Europe "in order to
provide a single uniform breakdown of territorial units for the production of regional
statistics for the European Union".
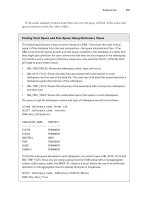
The difficulty to harmonize the geometry of nuts in time can be linked to the specificity
of NUTS themselves. It can be explained by:
The degree (level) of hierarchical organization of NUTS is very different (figure 10)
“(2) The NUTS classification is hierarchical. It subdivides each Member State into NUTS
level 1 territorial units, each of which is subdivided into NUTS level 2 territorial units,
these in turn each being subdivided into NUTS level 3 territorial units” (3). “However, a
particular territorial unit may be classified at several NUTS levels” (Regulation EC n°
1059/2003/Official Journal of the European Union L 154/1 of 21/06/2003).
5
/>
ESPON 2013 DATABASE – First Interim Report – 2009 February 27
21
Level of Nuts
NUTS0
LU
Luxembourg
(Grand-Duché)
EE Eesti
CZ Czech
Republic
DK Danmark
DE
Deutschland
DE
Deutschland
UK United
Kingdom
PL Polska
NUTS1
LU0
Luxembourg
(Grand-Duché)
EE0 Eesti
CZ 0 Czech
Republic
DK0 Danmark DE3 Berlin DE5 Bremen
UKF East
Midlands
(England)
PL1 Region
Centralny
NUTS2
LU00
Luxembourg
(Grand-Duché)
EE00 Eesti CZ01 Praha
DK01
Hovedstaden
DE30 Berlin DE50 Bremen
UKF3
Lincolnshire
PL12
Mazowieckie
NUTS3
LU000
Luxembourg
(Grand-Duché)
EE007 Kirde-
Eesti
CZ010 Hlavni
Mesto Praha
DK014
Bornholm
DE300 Berlin
DE502
Bremerhaven,
Kreisefreie
Stadt
UKF30
Lincolnshire
PL128
Radomski
Nuts
hierarchical
organisation
t
yp
es
0=1=2=3 0=1=2?3 0=1?2=3 0=1?2?3 0?1=2=3 0?1=2?3 0?1?2=3 0?1?2?3
Hierarchical possibilities
Figure 10 - Hierachical possibilities of NUTS
The NUTS divisions do not necessarily correspond to administrative divisions within the
country, which can affect the degree of evolution of NUTS in time and produces very
heterogeneous situations. This hypothesis depends on the national political system.
Semantic expertise: how NUTS can change in time?
To formalize temporal versions of NUTS we must identify the different possibilities of
NUTS’ changes.
As defined by the regulation of No 1059/2003 of 26/05/2003, NUTS is composed by:
name, code, geometry and hierarchy, which can change in time. To simplify we
propose five elementary kinds of change:
Î Change of name
Î Change of the spelling of the name
Î Change of code
Î Change of geometry
Î Change of hierarchical level
These different elementary changes determine the existence of NUTS, which can be
related to 3 main types of events:
Î The creation of new units
Î The breaking of units
Î The disparition of units
However, the evolution of NUTS is more complex. At first, several changes can happen
in the same time. Then, changes can affect many spatial units (see Annexe 2). The
proposed formalization should be capable of drawing the genealogy of the NUTS which
is a fundamental element for the harmonization of the time series.
ESPON 2013 DATABASE – First Interim Report – 2009 February 27
22
2.2.3.2 Missing value
Another common source of difficulty is the absence of data for some years or some
portion of the territory. Note that missing values are not an issue specific to time
series but a universal problem in statistical series, for which statistical approaches exist
like those detailed in the "Data Navigator II Report" of the Espon 3.2 project
6
. These
statistical methods can be useful in the case of simple gaps in the data series but not
for whole sections of the series unavailable, in which case other data should be used as
a workaround.
Nature Usual solution to consider Example
Interpolation or even extrapolation Population 2003 derived from
population 2002 and 2004
Missing values
Using proxy indicator (and make a
rule of three)
Using employment
distribution in economical
sectors instead of added
value distribution (rule of
three)
2.2.3.3 Indicator definition modification
Probably the most dangerous situation is a modification of the definition of an indicator
itself. This for instance happened with the GDP indicator at the European level in
1995, but also occurs recurrently with the unemployment indicators produced by the
different countries. The mission of a statistical institute like Eurostat involves a
normalization process in order to avoid disparities in the data provided by the different
countries. But whenever data are found directly in national or regional statistical
institutes the researchers must be aware of this risk. As a data collector Espon DB
must then either adapt these indicators whenever it is possible or at least warn the
user against the possible inconsistencies that might result from an inattentive use and
provide as much as possible a methodology to avoid them. This implies to specify the
exact definition of the data provided whenever it is relevant.
6
available at
ESPON 2013 DATABASE – First Interim Report – 2009 February 27
23
Nature Usual solution to consider Example
Using homogenized definitions
through time
The GDP data provided by
Eurostat are homogenized.
Indicator
modification
Using another indicator Using the International
Labour Organization
unemployment definition
instead of the official national
statistics
The inconsistencies in times series due to changes of NUTS and statistics are linked.
They will be simultaneously approached.
2.2.4 Work plan
The aim of this challenge is to provide a corpus of methodological solutions to build
harmonized temporal statistical series. Considering the difficulty and the complexity of
historical database mining, our objectives would be organized in to short and long
term. A first attempt will be made to define the NUTS dictionary boundaries changes
and to integrate basic indicators (population, GDP, unemployment, age structure)
between 2006 and 1995. A second step aims to enlarge the scope of changes
dictionary to cover large time evolution of nuts and world databases.
The progress of this challenge will be organized according these following steps:
February-June 2009
Diagnostic of time series’ availability in the ESPON area. The review of the different
sources can provide information about the times databases which can easily build.
Many classifications may be relevant: NUTS level, thematic, country, time periods….
This information can be transcribed in a summary table which will be very useful for
the projects and which will serve as a guide.
June- September 2009
Elaboration of dictionary NUTS’ changes. Based on the review of different sources, the
dictionary of changes is a methodological book which consists in:
Typology of changes
Key’s conversion of NUTS’ version (genealogy of units)
Spatio temporal data models
September 2009-Febrayry 2010
Computing data models and automating some proceedings. The integration of time in
layer-based GIS is a real problem for GIS and databases research. Many data models
have been proposed to incorporate temporal information into spatial databases but
there is no generally accepted model, which can satisfy all temporal GIS requirements.
This is due to the diversity of geographic objects’ characteristics.
ESPON 2013 DATABASE – First Interim Report – 2009 February 27
24
The progress of this challenge should be planned on the networking with other relevant
challenges of the project like challenge 1, 3, 4,7 and 9 (Figure 1).
ESPON 2013 DATABASE – First Interim Report – 2009 February 27
25
2.3 Challenge 3: World / Regional data
Coordinator: RIATE & UNEP
Harmonization of data at World/Neighbourhood and European/regional
levels.
2.3.1 Objectives
Based on the results of ESPON 2006 Program, we propose to examine in a systematic
way how to combine datasets at world/neighbourhood levels (where basic territorial
units are the states) and datasets at European/Regional levels (where basic territorial
units are NUTS2 or NUTS3 units). The interest of such connection is to enlarge the
scales of analysis from spatial point of view (situation of ESPON territory in the world,
situation of eastern and southern neighbouring countries) but also from historical point
of view as time series at state level are generally more easy to obtain on long period
(1960-Present) than regional time series (1995-Present).
2.3.2 Work done
The expert team UNEP has established contact with the lead partner RIATE in order to
exchange experience on world database and to compare more specifically the Europe in
the World database (EIW) realised by ESPON 2006 project 3.4.1 and the Global
Environment Outlook database (GEO) realised by UNEP-GRID Genève and available on
the internet
7
. After the joint presentation of both databases at the project meeting of
2-3 February 2009, it has been decided to launch specific actions in order to insure
compatibility between the new ESPON DB and the GEO database, taking into account
the experience gained in ESPON 2006 with the project EIW.
It is important to notice that the GEO database does not cover only socio-economic
data and is not limited to state as basic territorial units. Many other ressources are
available concerning for example environmental issues and different types of
geographical object are covered like grid data, cities, water basin, etc. The challenge 3
will focus in a first step on the elaboration of a territorial database of data at state
level, but it will also provide material for challenge 5 (grid data), challenge 6 (cities),
etc.
2.3.3 Identified difficulties
7