Tài liệu Have property funds performed? A ULI Europe Policy & Practice Committee report ppt
Bạn đang xem bản rút gọn của tài liệu. Xem và tải ngay bản đầy đủ của tài liệu tại đây (441.06 KB, 16 trang )
Have property funds performed?
Authors:
Professor Andrew Baum,
Academic Fellow ULI Europe
Jane Fear,
Manager, Feri Property Funds Research
Nick Colley,
Senior Analyst, Feri Property Funds Research
Editors:
Alexandra Notay,
Vice President of Strategic Programmes, ULI
Louise Evans,
Research Assistant, ULI
A ULI Europe Policy & Practice Committee report
February 2011
Funds Report_Layout 1 28/01/2011 12:24 Page 1
About ULI
ULI – the Urban Land Institute – is a non-profit research and education organisation supported by its members.
Founded in Chicago in 1936, the institute now has over 30,000 members in 95 countries worldwide, representing the
entire spectrum of land use and real estate development disciplines and working in private enterprise and public service.
In Europe, we have over 2,000 members supported by a regional office in London and a small team in Frankfurt.
ULI brings together leaders with a common commitment to improving professional standards, seeking the best use of
land and following excellent practices.
We are a think tank, providing advice and best practices in a neutral setting – valuable for practical learning, involving
public officials and engaging urban leaders who may not have a real estate background. By engaging experts from
various disciplines we can arrive at advanced answers to problems which would be difficult to achieve independently.
ULI shares knowledge through discussion forums, research, publications and electronic media. All these activities are
aimed at providing information that is practical, down to earth and useful so that on-the-ground changes can be made.
By building and sustaining a diverse network of local experts, we are able to address the current and future challenges
facing Europe’s cities.
To download a calendar of ULI events and activities for 2011, please visit www.uli.org/europe
www.uli.org
AREA Property Partners (AREA), formerly Apollo Real Estate Advisors, is an international real estate fund manager which
has acquired in excess of $30 billion of assets in more than 450 transactions. Co-founded and led by William Mack,
AREA serves as the general partner of a series of real estate investment funds totalling over $11.6 billion of equity
across nineteen funds and a number of institutional joint ventures. AREA has been investing in Europe since 1995
where it has successfully invested over $1.6 billion of equity in over 100 transactions across fifteen countries.
AREA's European investments are sourced and managed by AREA's London office.
Urban Land Institute
29 Gloucester Place Tel: +44 (0)20 7487 9570
London Fax: +44 (0)20 7486 8652
W1U 8HX Email:
United Kingdom Web: www.uli.org
Copyright ©2011 by ULI – the Urban Land Institute.
ULI Europe, all rights reserved. No part of this report may be reproduced in any form or by any means, electronic or
mechanical, including photocopying or recording, or by any information storage and retrieval system, without written
permission of the publisher.
For more information on ULI Research and Publications, please contact Alexandra Notay, Vice President,
Strategic Programmes,
Funds Report_Layout 1 28/01/2011 12:24 Page 2
1
Funds Symposium Report | ULI 2011
1
Professor Andrew Baum
Andrew Baum is Academic Fellow for ULI Europe, professor of Land Management at the Henley
Business School, University of Reading and Honorary Professor of Real Estate Investment at the
University of Cambridge. He is an independent advisor to Feri Property Funds Research, CBRE
Investors, Internos Real Investors and Redevco.
Jane Fear, Feri Property Funds Research
Jane Fear is Manager of Feri Property Funds Research. Jane has an MSc in Land Management from
the University of Reading and a BA (Hons) in Geography from Oxford University.
Nick Colley, Feri Property Funds Research
Nick Colley is a Senior Analyst at Feri Property Funds Research. Nick has an MSc in Real Estate at
Oxford Brookes University and a BA (Hons) in Geography at the University of Southampton.
Editors:
Alexandra Notay,
Vice President of Strategic Programmes, ULI – the Urban Land Institute
Louise Evans, Research Assistant, ULI - the Urban Land Institute
ULI Europe are extremely grateful to the symposium delegates and survey respondents who made this
complex research possible. Whilst many remain anonymous, a list of acknowledgements is on the
inside back cover. The ULI team takes full responsibility for all errors or omissions in the text.
Biographies
Introduction 2
Summary 2
1. Background 3
2. What are the characteristics of the investment styles? 3
3. The unlisted fund universe 4
4. How can funds out-perform? 4
5. Data and method 5
6. Results 6
7. The impact of debt 7
8. Selection risk 7
9. Timing effect 8
10. Are returns driven by alpha or beta? 9
11. The impact of fees 9
12. Limitations 10
13. Conclusions 11
14. What next for the real estate fund industry? 12
Acknowledgements Inside back cover
Contents
Funds Report_Layout 1 28/01/2011 12:24 Page 1
2
Introduction
In November 2010, ULI held a Funds Symposium
hosted by AREA Property Partners in London,
with 35 leading Fund Managers, Investors and
Academics. This document is an executive
summary of the research presented by ULI
Academic Fellow, Professor Andrew Baum and
of the roundtable discussion afterwards.
All quotations are anonymous.
Summary
Opportunity funds have delivered higher returns than core funds over the
period 2003-2009. While core fund returns have been especially
disappointing, deeper analysis suggests that the additional returns delivered
by the opportunity funds may not be adequate to compensate
investors for the significantly higher levels of risk taken by fund managers to
achieve these returns. With highly significant levels of 'beta' calculated in the
opportunity fund samples and the closeness of the observed returns to
hypothetical geared returns, the research found that opportunity fund returns
over this period have been driven primarily through pure leverage and at a
cost of huge risk to the investor. Performance fees charged by fund managers
appear to reward pure risk-taking (beta) rather than manager skill (alpha).
There is some evidence of ‘alpha’ being generated by fund managers through
'skilful transaction activity and asset management. Opportunity fund
managers also appear to have generated superior returns through controlling
the timing of the buying and selling of assets, although, with performance
fees generally charged on IRRs rather than time-weighted returns, it is open to
debate as to whom this benefits more - the investor or the fund manager.
Generally, core funds were found to have much higher levels of market risk
than expected as the sample was found to have a higher than expected beta of
1.61. The research found that core funds have failed to track the direct
property index' and have a wider spread of returns than would be expected.
This appears to be the consequence of the use of leverage.
Funds Report_Layout 1 28/01/2011 12:24 Page 2
3
Funds Symposium Report | ULI 2011
1. Background
Since the mid 1990s there has been a significant growth in the aggregate
size and number of global property funds, largely fuelled by the investment
of significant capital from institutional investors. This falls into two broad
types: the 'core' universe and the 'opportunity' universe.
This growth has seen fund managers launching new funds and raising more
capital at a time when many have been unable to show clear evidence that
their funds have provided historic out-performance against market
benchmarks or performance objectives. Despite the lack of
transparency/clarity as to how well funds perform compared to their peer
group and/or the direct market, many fund management houses have been
rewarded with performance fees which they may or may not have deserved.
In a more challenging, mature, and increasingly transparent market, this is
unlikely to continue to be the case as it is increasingly possible to assemble
performance records. Investors are becoming more assertive, and
regulations/directives are playing an increasingly important role in the
need for disclosure and accountability. The question of how manager
performance is rewarded is therefore a key issue for the industry: do
performance-related fees, for example, adequately distinguish between
risk taking (higher beta) and genuine skill/out-performance (alpha)?
This research aims to start to address some of the following issues.
• How has the performance of core funds and opportunity funds
compared over periods of market strength and market weakness?
• To what extent can the relative performance be explained by leverage?
• Have the performance fees paid to managers been fairly earned?
2. What are the characteristics of the
investment styles?
Funds are differentiated by risk type. Some industry participants have
distinguished funds by using four styles - core, core-plus, value-added
and opportunity. More common is the INREV and Property Funds Research
(PFR) standard of three styles: core, value-added and opportunity.
• Core funds are low-risk funds with no or low gearing, often o
pen-ended, and should arguably aim to closely replicate returns on an
index of direct real estate. Core-plus funds are included in this style
and invest in similar assets to core funds, but adopt a more aggressive
management style.
• Value-added funds have some potential for value-enhancement through
re-letting empty space, refurbishment work, or other active asset
management activity.
• Opportunity funds are higher risk, higher target return funds with high
levels of gearing.
Figure 1 illustrates where the various fund styles are positioned
along the risk/return profile of the security market line.
Figure 1: Fund investment style characteristics
Source: CBRE Investors
We suggest that core/core-plus funds may be distinguished from
value-added and opportunity funds by (i) risk appetite and (ii) their
often-expressed objective to deliver returns relative to a market benchmark,
especially in the UK and other developed markets with good, well-accepted
benchmarks. However, although various bodies try to do so, it is difficult to
prescribe a fund style by reference to hard criteria. As a result, the style
ascribed to a fund will more often than not be defined by the fund manager,
and this can lead to inconsistency in the classification of funds. For the
purposes of this research the core universe is defined to include funds that
employ a core/core-plus investment strategy, and the opportunity universe,
which we define to include both value-added funds and opportunity funds.
Funds Report_Layout 1 28/01/2011 12:24 Page 3
Af
$
3
0.
1
Latin
America
$23bn
1%
Middle
East
$5bn
0.22%
North
America
$809bn
37%
rica
3
bn
1
4%
Asia
$376bn
17%
Australasia
$114bn
5%
Europe
$888bn
40%
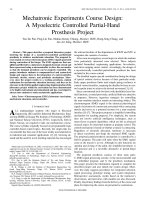
3. The unlisted fund universe
PFR estimates the size of the unlisted real estate fund universe to be
worth approximately US$2.2 trillion or 14% of the total investable real
estate universe
1
.
Figure 2: The size of the unlisted fund market
Source: PFR, 2010
Of this $2.2 trillion, approximately one third is invested in core/core-plus
funds, a further third in opportunistic funds and the remaining third in
value-added funds. This simplistic split of the universe by style is not
reflected in the geographic distribution of funds. For example, global/
multi-regional funds are largely opportunistic in style, as shown in Figure 3.
Figure 3: The breakdown of fund styles by target region
Source: PFR, 2010
4
“The alpha that the people around this table
bring is the timing of the exit – although you
can’t control the exit in a downturn like the
one we’ve just experienced.”
Symposium delegate
4. How can funds out-perform?
When analysing the performance of a fund, a key issue that needs to be
addressed is whether fund returns have been driven through risk taking
activities (beta) or manager skill (alpha). This is illustrated in Figure 4,
where alpha represents out-performance of the market (represented by the
security market line) given the level of associated risk.
Finance theory clearly suggests that higher risk investments should earn
higher returns. This does not require skill. As many fund managers receive
performance fees for high returns, it should be important for investors to
ascertain whether fund managers have been rewarded for returns generated
by risk taking (with investors' capital) or whether they have earned these
fees through their skill, delivering higher returns through alpha.
Figure 4: Alpha & beta
Source: Baum, 2009
2
1
Estimated by PFR using methodologies developed by Pramerica Real Estate Investors and
Chin & Dziewulska
2
Baum, A.(2009): Commercial Real Estate Investment, a Strategic Approach, Elsevier
Funds Report_Layout 1 28/01/2011 12:24 Page 4
5
Funds Symposium Report | ULI 2011
Fund managers can exercise skill (alpha) when structuring their funds, from
the portfolio structure, and from property or stock. Fund structure is largely
defined by leverage, although fee structures also have an impact. Skill at
this level requires some provable excellence in arranging the debt that is
put in place. Out-performance at the portfolio level is delivered by managers
who, all things being equal, allocate relatively more to out-performing
sectors or geographies. This implies that the manager has a forecasting
capability which is the source of their out-performance. Out-performance
at the stock level is derived from ongoing asset management activities,
including property management. The buying and selling of properties can
also generate stock alpha. Managers who are able to purchase assets at
discounts, recognise latent value that is not reflected in valuations,
negotiate attractive prices, and have the ability to execute more complex
deals and thus face less competitive pricing, will, all things being equal,
out-perform their benchmarks.
Property investment risk (beta), like alpha, can also be broadly separated
into fund, portfolio and stock beta. Fund beta arises from the amount of
leverage employed. Portfolio beta arises from allocations to more volatile
sectors such as CBD office markets; exposure to more risky geographies,
such as emerging markets, are a source of additional beta.
Stock level beta is based on a continuum of asset level risk ranging from
low beta ground rent investments, to higher beta assets with leasing risk
and high vacancy, to high beta speculative developments.
5. Data and method
The research covered the years from 2003 to 2009 (effectively the longest
period available for which sufficient global funds have been in existence).
This has clearly been a highly unusual and very challenging period for real
estate fund managers. The research provided a data sample which covered
the real estate market when returns have been both very high and very low,
providing an insight into how the different investment styles behaved during
different periods of the market cycle. Nonetheless, caution is advisable in
generalising from results drawn from this short period.
The sample includes funds that target a variety of sectors including
diversified, residential, retail, office and industrial. It also covered a number
of geographic regions including Europe, North America and global
(multi-region). Direct property return data was sourced from the IPD global
index and the indexes of the constitutent countries/regions. The core fund
data was made up of the IPD pooled fund indices and NCREIF Townsend
US Core Fund Index for North America.Where no fund index was available,
the IPD direct index was used. The global core fund returns were created
by weighting the returns of the pooled fund and direct market indices
according to the global core fund data held by PFR.
Opportunity fund data is hard to collect, but some return data is available
from investor and manager reports. In addition, PFR collected primary
data on opportunity funds. This brought the opportunity fund sample to
273 funds with a value of $428bn, which accounts for around 38% of
PFR’s estimated opportunity fund universe by value.
Funds Report_Layout 1 28/01/2011 12:24 Page 5
When the time-weighted rate of returns (TWRR) of the fund samples are
compared, the opportunity funds again out-performed during the strong
performing market and under-performed during the weak direct market
(see Table 1). Over the whole period European opportunity funds
out-performed core funds by 1.13% on a TWRR basis compared to
4.39% for funds targeting global investment.
During the earlier period, European opportunity funds delivered a TWRR
12.70% higher than the European core fund sample; during the latter period
opportunity funds delivered returns 5.79% lower than the core fund sample.
Table 1: Core v opportunity fund time-weighted rates of return
(Europe) 2003-2006 2007-2009 2003-2009 Std.dev CV*
Core
11.81 -8.71 2.50 13.27 0.19
Opp
24.50 -14.5 3.64 26.76 0.14
Rel
12.70 -5.79 1.13 - -
(Global) 2003-2006 2007-2009 2003-2009 Std.dev CV*
Core
12.96 -8.62 3.15 14.39 0.22
Opp
37.73 -22.68 7.54 36.26 0.21
Rel
24.77 -14.06 4.39 - -
*CV = coefficient of variation
Source: PFR, IPD, 2010
On a risk-adjusted basis, core funds out-performed the opportunity funds,
but only just, with European core funds delivering a risk-adjusted return of
0.19 compared with 0.14 for European opportunity funds.
6
6. Results
This section focuses primarily on European core and opportunity funds, as
these samples provided the fullest most internally consistent data.
Figure 5 clearly illustrates that the annual total returns delivered by
European core funds out-performed the direct market in years of strong
performance (2003-06) but significantly under-performed during years of
weak direct market performance (2007-09). A similar pattern is seen in the
European opportunity fund sample, with strong annual total return
out-performance of the direct market delivered in 2003-06 but significant
under-performance of the market in 2007-09.
When annual total returns are compared (see Figure 5), the average total
return for European opportunity funds delivered out-performance over
European core funds of just over 4% p.a. over the whole period. The core
funds recorded an average annual total return of 3.3% compared to
7.4% for the opportunity funds.
The highest annual total return out-performance by European opportunity
funds occurred in 2004 with a relative return that was 17% higher than the
core fund sample. The lowest under-performance was in 2008, where
European opportunity funds delivered returns 25% lower than core funds.
Core funds, as expected, had a much lower standard deviation than the
opportunistic funds (13.27% and 26.76% respectively) with tracking errors
relative to direct market returns of 5.45% for core funds and 19.37% for the
opportunity funds recorded.
Figure 5: European core and opportunity funds v direct returns
Source: IPD, PFR, 2010
Funds Report_Layout 1 28/01/2011 12:24 Page 6
7
Funds Symposium Report | ULI 2011
7. The impact of debt
We compared the performance of core funds to the performance of the
relevant direct property index, adjusted for leverage. The fit is very powerful,
suggesting significant beta for the sample as a whole, as would be
predicted. But the beta is higher than we expected. Using 20% and 35%
gearing ratios (see Figure 6), the core funds out-perform in the strong
market but significantly under-perform during the period of weak market
performance. These findings can partially be explained by the increasing
levels of debt being employed by the core funds in the sample. The average
level of debt measured as a percentage of GAV was between 20-25%, but
the beta is higher than this suggests.
(The hypothetical returns are calculated net of interest costs using interest
rates based on adding LIBOR to the reported average margins of prime (for
core funds) and secondary (for opportunity funds) assets reported by the
UK Commercial Property Lending Survey [De Montfort University, 2010].)
Figure 6: European core funds v modelled returns (20%)
Source: PFR, IPD, 2010
The opportunity fund sample, with average gearing of 65%, out-performed
the hypothetical 65% geared fund index during the 2003-2005 period, but
from 2006-2009 the opportunity funds either matched or under-performed
the hypothetical geared returns. The results suggest that opportunity fund
managers have failed to deliver consistent out-performance (alpha) over
the whole time period and that leverage is a significant driver of the
performance of opportunity funds - a pure beta activity.
Figure 7: Opportunity fund returns v hypothetical returns
Source: PFR, IPD, 2010
8. Selection risk
The core fund sample has displayed evidence of increasing risk levels in
the spread of returns, suggesting that core funds have drifted in style
and moved up the risk return spectrum in the era of ‘cheap’ debt, thereby
increasing the level of beta in the funds. This argument appears to be
supported by a comparison with 35% geared hypothetical returns, which
is a better fit with the observed returns (see Figure 6).
Selection risk in the UK funds is illustrated in Figure 8. The range of
returns also widens during the time series, resulting in an increased level
of selection risk for the investor.
Figure 8: Range of UK core fund annual total returns
Source: AREF, IPD, 2010
The opportunity fund sample displays a greater range of annual total
returns than core funds both within and across the time series. The spread
of returns also increased over the time period.
Figure 9: Range of European opportunity fund annual
total returns
Source: PFR, 2010
Funds Report_Layout 1 28/01/2011 12:24 Page 7
8
For the investor in opportunity funds, selection risk by vintage year
(launch year) and fund manager plays a significant role in assessing the
risks associated with opportunistic investing. While valuation practice
varies across opportunity funds, and this factor has exaggerated this
particular observation, the range of returns across managers has been
extremely high. Average returns vary by vintage year, 2002 being best, and
2007 worst, and fund selection risk varies considerably by vintage year,
peaking in 2006. The vintage year and manager selection risk clearly
makes diversification important for investors.
Figure 10: Fund IRR by vintage year
Source: PFR, 2010
The selection risks associated with opportunity funds are higher than for
core funds, but both core and opportunity fund samples exhibit a negative
skew, meaning that there were more fund ‘losers’ than ‘winners’, and a
positive excess kurtosis, meaning there is a higher probability of an
investor receiving an extreme return.
“Vintage is important – the market is
dominant, not the manager’s skill.”
Symposium delegate
9. Timing effect
Opportunity funds, with their closed-ended structures, provide the manager
with a significant opportunity to add alpha through timing. As proposed by
Baum and Farrelly
3
, the ‘timing effect’ can be measured by subtracting the
fund level TWRR from the IRR. Table 2 applies this theory to opportunity
funds in the sample. Despite the limited sample size, the findings of the
analysis reinforce the hypothesis that opportunity fund managers can add
significant value or alpha through the timing of market entry and exit.
Table 2: Opportunity fund ‘timing effect’
Target Launch End IRR TWRR Timing
Sector Year Year effect
Fund 1 Diversified 2000 2010 35.30 21.90 13.40
Fund 2 Diversified 2003 2010 10.82 5.34 5.48
Fund 3 Diversified 2008 2010 31.30 27.60 3.70
Source: PFR, 2010
It is important to note that the majority of funds in the opportunistic
sample are still live, and therefore the true impact of successful exits will
not be reflected in the annual total returns. During the symposium
discussion, it was requested that further research should target funds that
had fully wound-up in order to provide evidence of how fund performance
is impacted by the manager’s exit strategy. The success of this part of the
research would clearly depend on the provision of data by the managers.
Unlike opportunity funds, core funds often adopt an open-ended
structure, which provides the investor with the opportunity to create alpha
by deciding when to enter or exit a fund. This structure makes it harder for
a fund manager to add value, or alpha, as they do not have the same level
of cash flow control as the managers of closed-ended structures. As
investors found during the downturn, some open-ended funds are only
open until they are closed, removing this alpha-generating opportunity
from the investor.
“Open-ended funds have a nasty habit
of being less than open.”
Symposium delegate
3
Baum, A. & Farrelly, K. 2009, ‘Sources of alpha and beta in property funds: a case study’,
Journal of European Real Estate Research, Vol.2, No.3, pp. 218-234.
Funds Report_Layout 1 28/01/2011 12:24 Page 8
9
Funds Symposium Report | ULI 2011
10. Are returns driven by alpha or beta?
Table 3 provides the results of a regression analysis conducted on
European and global core and opportunity funds. The findings reinforce
the concern that performance has been driven primarily by beta rather than
alpha, with a negative alpha and high positive beta coefficients found in all
the samples. The core fund sample was found to have a beta of 1.6 (with a
high statistical significance) and alphas of -3.8 to -6.3 (just statistically
significant). The beta figure is higher than expected, given our proposition
that core funds should track the direct market index and deliver betas of
around one.
The opportunistic funds had high betas ranging from 3 to 3.6 and negative
alphas of -6.3 to -8.6, confirming that the performance of opportunity funds
appears to be driven largely by higher risk taking, of which the use of debt
appears to be a significant factor.
Table 3: Alpha and beta coefficients
Alpha Beta t-stat (α) t-stat (β) R Tracking
squared error
Europe core -3.88 1.61 -3.58 13.01 0.97* 5.45
Global core -6.30 1.63 -6.97 18.60 0.99* 5.81
Europe opp -6.32 3.09 -1.40 5.96 0.88 19.37
Global opp -8.64 3.60 -0.91 3.89 0.75 29.01
*Note that 97-99% R-squared illustrates non-independent samples –
core fund property is significant in the index
Source: PFR, IPD, 2010
11. The impact of fees
Fund managers of unlisted real estate funds have varying fee structures.
Using data from the PFR database, the most common fee structures are
detailed in Table 4.
Table 4: Average management fees
Asset Hurdle Performance fee
management rate
fee
Core funds 0.75% GAV Rare
Opportunity 1-1.75% of 10% Most common is a 20/80 split after
funds capital hurdle rate.
committed A significant number of funds have a
50/50 catch-up until the GP has
achieved 20% of the profits, before
reducing to a 20/80 split.
Source: PFR, 2010
Core funds generally only charge a management fee, typically 0.75% of
GAV, and rarely charge performance-related fees. Opportunity funds
typically charge a management fee which is usually 1-1.75% of capital
committed (similar to core funds if expressed as a percentage of GAV).
Opportunity funds also charge a performance fee. Performance fees have
a significant impact on the returns received by the investor as the fund
manager takes a share of the profits above a pre-determined hurdle rate.
This is illustrated in Figure 11, where a 20/80 split above a 10% hurdle
rate has been expressed as a percentage of the gross IRR. For example, if
a fund has generated a gross IRR of 40%, the performance fees would
reduce the IRR received by investors to 34%, representing a reduction
of 15% of the return.
It is important to note that the fee impact modelled in this research does not
include any catch up provisions. Fund managers might, for example, charge
50% of all profits over a 10% IRR until they receive 20% of all returns, after
which the performance fee reverts to the 20/80 split. If there is a catch-up
provision of this type, fees would have a greater impact than our model
indicates.
Figure 11: Opportunity fund performance fee impact (% of IRR)
Source: PFR, 2010
Funds Report_Layout 1 28/01/2011 12:24 Page 9
10
Figure 12 shows the annual total returns for global opportunity funds, both
gross and net of performance fees, against a hypothetical 70% geared index
return. The average annual out-performance (alpha) for gross of fee
performance is around 3.5%, compared to 0.35% for net of performance fee
returns. This means that there is some evident ‘alpha’ before, but this has
been eroded by performance fees.
Because the opportunity funds analysed are mainly live, most performance
fees have not been taken out, but we have estimated notional fees as if they
arise annually. Implied performance fees have been deducted for the live
opportunity funds, which is a distortion of the true results that will be
delivered by the funds once capital has finally been returned to investors
and fees deducted at that point. This may overstate the eventual fee impact.
Figure 12: Global opportunity fund gross v net of performance
fee returns
Source, PFR, IPD, 2010
12. Limitations
This research is important, as it provides a rare basis for discussing the
performance of real estate funds. Nonetheless, there are some limitations
to the findings that could influence the interpretation of the results.
First, do we really know what investors want? If not, how can we challenge
the delivered returns?
Second, this was clearly a highly unusual period, and this is a relatively
new industry, with insufficient consistent data to draw very strong
conclusions.
Third, we are not confident that measures of annual returns for opportunity
funds are meaningful, as we are not sure that all the funds in our sample
have re-valued annually. Consequently, there is some potential confusion
hidden within a multiplicity of different return measures, including annual
total return, TWRR and IRRs.
Fourth, the lack of transparency and/or consistency in fund reporting means
that the reported annual returns may not be a true reflection of the actual
performance of the fund. For instance, differences in valuation policies
could have affected the performance of the sample. Some fund managers
employ a policy of downwards-only valuation, and would only expect to
see the positive impact of capital growth once the assets have been sold.
Conversely, some fund managers adopt an upwards-only valuation which
would mean that the returns are under-stating the performance of the
underlying assets. Anecdotal evidence suggests that the valuation of fund
assets may have been aggressively marked down during the downturn, and
as a result overstated the decline, so that the performance of these funds
over the next 2-3 years is be expected to be very strong.
“One of the issues is valuation. Property
doesn’t work very well with annual statistics.
We use that to promote property as a
diversifier against stocks and bonds but
basically valuations are slightly random.”
Symposium delegate
Funds Report_Layout 1 28/01/2011 12:24 Page 10
11
Funds Symposium Report | ULI 2011
13. Conclusions
Over the time period 2003-2009, opportunity funds delivered higher returns
than core funds. Whether the additional returns delivered by the opportunity
funds are sufficient to compensate investors for the risks taken to achieve
these returns is less clear. The study found highly significant levels of high
betas (around 3) evident in the opportunity fund returns, which were driven
primarily by the market and leverage at the cost of significant risk to the
investor. There is a clear danger that performance fees charged by managers
can reward risk-taking (high beta) rather than manager skill (alpha).
There is some evidence of ‘alpha’ having been generated by fund managers,
partly through positive structure and stock effects, and also through timing,
in other words controlling the timing of cash drawdowns and asset sales.
Given that performance fees are generally charged on IRRs rather than
TWRR, it is open to debate as to whether this is primarily for the benefit of
the investor or the fund manager. .
Generally, core funds were found to have higher levels of risk than
anticipated and the sample was found to have a higher than expected beta
of 1.6. (This could add as much as 2% - plus fees - to the required return
for a core fund.*) The research found that core funds have not tracked the
direct property index as closely as expected, and as a result they have
delivered a wide spread of returns across managers. This appears to be
the consequence of the use of leverage, especially in recent years.
If core funds do not track the direct market, then this places a question mark
over the rationale behind investing in them. If an investor wants a core fund
to be a relative return product tracking an index/direct market, core funds
are very likely to fail to deliver. If they are regarded as absolute 5-8% return
funds, core funds have failed to meet these requirements, producing a
time-weighted rate of return of only 2.5%. This is an under-performance
of 2.5-4.5% pa on an absolute return basis.
The wide spread of returns observed in the opportunity fund sample
highlights the fact that manager and/or fund selection risk is high.
Some managers clearly have performed higher than the market average
and delivered value, while some managers have delivered truly shocking
returns in albeit very challenging conditions.
With closed-ended fund structures there is also a vintage year selection
risk. The vintage year IRR analysis clearly shows that there is a wide
dispersion of returns being generated both within and across the vintage
years of opportunity funds. With this in mind, it was suggested at the
symposium that now could be an ideal time to invest in opportunity funds.
The current economic climate has made it increasingly difficult for fund
managers to raise new funds aimed at taking advantage of the
unprecedented fall in the value of real estate. Managers that have raised
capital and have market access should have a significant performance
advantage with significantly less competition for opportunistic assets.
These funds have the potential to deliver significant ‘alpha’, and the
industry could find that the fund vintages of 2009-2011 may deliver
very strong performance.
This research concludes that real estate funds in general have not delivered
the required risk return characteristics that investors would have expected
or are led to believe. The traditional model of real estate sitting somewhere
in between bonds (lower risk/return) and equities (higher risk/return) is
challenged, with investors increasingly asking themselves that if real
estate cannot deliver the desired risk/return in-between equities and bonds,
then why invest?
“This research tells you there are some
real challenges for both opportunity and
core funds.”
“Property isn’t performing! Not just
opportunity or core funds.”
“The lack of capital being committed now,
means that the 2009-11 vintages will have
greater stock selection and this could mean
some very high IRRs.”
“If the funds industry can’t deliver, then we
will go back to bonds and equities!”
Symposium delegates
*Note: Using the capital asset pricing model, required returns are a function of the risk free rate, say the long bond yield of around 4%, plus beta multiplied by the market risk
premium for property, say 3%. A beta of 1.6 therefore suggests a required return of almost 9% - or 10% before fees - for core property funds, against the required return for
property of 7%. A beta of 3 suggests a required return of 13% for opportunity funds after fees. From Figure 11, this suggests gross required returns of around 15%, which is a
less surprising number than the required return on core funds.
Funds Report_Layout 1 28/01/2011 12:24 Page 11
12
14. What next for the real estate fund industry?
The purpose of the research was to initiate a debate on the performance of
real estate funds and the implications that this may have for the future of the
unlisted fund industry.
One pertinent question to ask is whether the closed-ended fund model is
suitable for real estate investment. One argument we encountered is that
real estate is a long-term investment and therefore unsuited to the
‘short-term’ investment structures of closed-end funds when compared
to the relatively long-term investment model of real estate operating
companies.
Questions can be asked about the relationship between the fund manager
and the investor for example, who is ultimately responsible for the losses
recorded in the real estate fund market? Is it the responsibility of the fund
manager or investors to decide when to enter the market? Some argue that
the weight of money that was placed into the market by investors created an
asset bubble with fund managers obliged to buy assets at the top of the
market.
There are some real lessons to be learned by the industry from this
research and the debate which followed. Investors clearly resent a loss
of control if it carries with it poor performance and high fees. Future
developments in the unlisted fund market will probably involve an increase
in the number of joint venture and ‘club’ type of investment vehicles.
These allow smaller numbers of investors to take a more active role on
fund advisory boards, as well as creating greater transparency between
the manager and investor, facilitating greater dialogue between the parties.
This could lead to a better understanding and implementation of the
investors’ requirements.
The changing regulatory landscape (e.g. AIFMD, Solvency II) is likely to
further influence the relationship between investors and fund managers.
New risk measurement targets could impact on the frequency of fund
reporting and the requirement of the investor to truly understand the
underlying risks of an investment/fund. This may create pressure on fund
managers to adopt a uniform approach in fund accounting and reporting,
so that their clients can meet these regulatory requirements.
Fund managers may also face increasing pressure from investors to
demonstrate that the fees earned are for demonstrable manager skill or
alpha, rather than through pure risk taking. More research is required to
ascertain the best method by which a fund manager can demonstrate alpha,
and will require the input of all stakeholders in the industry.
The growth seen in the unlisted market has helped facilitate growing
cross-border property investment in Europe and across the world and
unlisted funds have become a preferred conduit. However, it appears that
core funds have failed to track the property index while opportunity funds
'have delivered higher returns primarily by taking risk. This raises questions
about the justification for performance fees and lays down a clear challenge
to the fund industry as it emerges from the credit crisis.
“The bust will come again, and, just as before,
those fixated by the short term will have too
much leverage and will fail.”
“There’s only one fund manager that we’ve
worked with that recommended to come out at
the top of the market. It hardly ever happens.”
“I want fund managers to say it is not a good
time to invest.”
“We are not having these dialogues with
investors and we should be. The best thing
we can do in this industry is have a dialogue
like this, and this is the first step.”
“The popularity of joint ventures with smaller
numbers of investors and increased investor
participation could increase. All these
characteristics are coming together to
create a different model.”
The ‘club’ model could create a conflict of
interest for fund managers, with some LPs
wanting to invest whilst others wanting to
withdraw capital. What does the fund
manager do in this situation? You can’t
please everyone.”
Symposium delegates
Funds Report_Layout 1 28/01/2011 12:24 Page 12
Contributors
ULI is extremely grateful to all the expert contributors listed below as well
as those who do not wish to be named.
• IPD – for the provision of direct market and fund indices
• Fund managers that returned questionnaires
>
Aberdeen Asset Management
>
Aviva Investors
>
AXA Real Estate
>
The Carlyle Group
>
CB Richard Ellis Investors
>
F&C REIT Asset Management
>
FundBox
>
ING Real Estate Investment Management
>
JP Morgan Asset Management – Global Real Assets
>
Schroder Property Investment Management
>
Tishman Speyer
• Symposium delegates
Funds Report_Layout 1 28/01/2011 12:24 Page 13
Copyright ©2011 by ULI – the Urban Land Institute.
ULI Europe, all rights reserved. No part of this report may be reproduced in any form or by any means, electronic or
mechanical, including photocopying or recording, or by any information storage and retrieval system, without written
permission of the publisher.
For more information on ULI Research and Publications, please contact Alexandra Notay, Vice President,
Strategic Programmes,
About ULI
ULI – the Urban Land Institute – is a non-profit research and education organisation supported by its members.
Founded in Chicago in 1936, the institute now has over 30,000 members in 95 countries worldwide, representing
the entire spectrum of land use and real estate development disciplines and working in private enterprise and
public service. In Europe, we have over 2,000 members supported by a regional office in London and a small
team in Frankfurt.
ULI brings together leaders with a common commitment to improving professional standards, seeking the best
use of land and following excellent practices.
To download a calendar of ULI events and activities for 2011, please visit
www.uli.org/europe
www.uli.org
ULI is grateful to AREA Property Partners for their support in the development of this research.
Urban Land Institute
29 Gloucester Place Tel: +44 (0)20 7487 9570
London Fax: +44 (0)20 7486 8652
W1U 8HX Email:
United Kingdom Web: www.uli.org
ULI connects local expertise with global knowledge to create opportunities. Join ULI’s 30,000 members for
access to objective information and the experience of those active around the world in every discipline of real
estate development, investment and regulation.
®
www.fsc.org
MIX
From responsible
sources
FSC
®
TT-COC-002846
Funds Report_Layout 1 28/01/2011 12:24 Page 14