Tài liệu USA INC. A BASIC SUMMARY OF AMERICA''''S FINANCIAL STATEMENTS pdf
Bạn đang xem bản rút gọn của tài liệu. Xem và tải ngay bản đầy đủ của tài liệu tại đây (4.44 MB, 266 trang )
www.kpcb.com USA Inc.
www.kpcb.com USA Inc.
About USA Inc.
This report looks at the federal government as if it were a business, with the goal of informing the
debate about our nation’s financial situation and outlook. In it, we examine USA Inc.’s income
statement and balance sheet. We aim to interpret the underlying data and facts and illustrate
patterns and trends in easy-to-understand ways. We analyze the drivers of federal revenue and
the history of expense growth, and we examine basic scenarios for how America might move
toward positive cash flow.
Thanks go out to Liang Wu and Fred Miller and former Morgan Stanley colleagues whose
contributions to this report were invaluable. In addition, Richard Ravitch, Emil Henry, Laura
Tyson, Al Gore, Meg Whitman, John Cogan, Peter Orszag and Chris Liddell provided inspiration
and insights as the report developed. It includes a 2-page foreword; a 12-page text summary;
and 460 PowerPoint slides containing data-rich observations. There’s a lot of material – think of
it as a book that happens to be a slide presentation.
We hope the slides in particular provide relevant context for the debate about America’s
financials. To kick-start the dialogue, we are making the entire slide portion of the report
available as a single work for non-commercial distribution (but not for excerpting, or modifying or
creating derivatives) under the Creative Commons license. The spirit of connectivity and sharing
has become the essence of the Internet, and we encourage interested parties to use the slides to
advance the discussion of America’s financial present and future. If you would like to add your
own data-driven observations, contribute your insights, improve or clarify ours, please contact us
to request permission and provide your suggestions. This document is only a starting point for
discussion; the information in it will benefit greatly from your thoughtful input.
This report is available online and on iPad at www.kpcb.com/usainc
In addition, print copies are available at www.amazon.com
ii
Created and Compiled by Mary Meeker
February 2011
www.kpcb.com USA Inc.
Foreword
Our country is in deep financial trouble. Federal, state and local governments are deep in debt
yet continue to spend beyond their means, seemingly unable to stop. Our current path is simply
unsustainable. What to do?
A lot of people have offered suggestions and proposed solutions. Few follow the four key
guideposts to success that we see for setting our country back on the right path:
1) create a deep and widely held perception of the reality of the problem and the stakes involved;
2) reassure citizens that there are practical solutions;
3) develop support in key constituencies; and
4) determine the right timing to deliver the solutions.
USA Inc. uses each of these guideposts, and more; it is full of ideas that can help us build a
better future for our children and our country.
First, Mary Meeker and her co-contributors describe America’s problems in an imaginative way
that should allow anyone to grasp them both intellectually and emotionally. By imagining the
federal government as a company, they provide a simple framework for understanding our
current situation. They show how deficits are piling up on our income statement as spending
outstrips income and how our liabilities far exceed nominal assets on our balance sheet. USA
Inc. also considers additional assets – hard to value physical assets and our intangible wealth –
our creativity and energy and our tradition of an open, competitive society.
Additionally, the report considers important trends, pointing specifically to an intolerable failure to
educate many in the K-12 grades, despite our knowledge of how to do so. And all these
important emotional arguments help drive a gut reaction to add to data provided to reinforce the
intellectual reasons we already have.
Second, USA Inc. provides a productive way to think about solving our challenges. Once we
have created an emotional and intellectual connection to the problem, we want people to act and
drive the solution, not to throw up their hands in frustration. The authors’ ingenious indirect
approach is to ask what a turnaround expert would do and what questions he or she would ask.
The report describes how we first stumbled into this mess, by failing to predict the magnitude of
program costs, by creating perverse incentives for excessive behavior, and by missing important
trends. By pointing to the impact of individual responsibility, USA Inc. gives us reason to believe
that a practical solution exists and can be realized.
George P. Shultz, Paul Volcker, Michael Bloomberg, Richard Ravitch and John Doerr
February 2011
iii
www.kpcb.com USA Inc.
Third, the report highlights how powerful bipartisan constituencies have emerged in the past to
tackle great issues for the betterment of our nation, including tax reform, civil liberties,
healthcare, education and national defense. Just as presidents of both parties rose to the
occasion to preside over the difficult process of containment during the half-century cold war, we
know we can still find leaders who are willing to step up and overcome political or philosophical
differences for a good cause, even in these difficult times.
Finally, the report makes an important contribution to the question of timing. Momentum will
follow once the process begins to gain support, and USA Inc. should help by stimulating broad
recognition and understanding of the challenges, by providing ways to think about solutions, and
by helping constituencies of action to emerge. As the old saying goes, “If not now, when? If not
us, who?”
With this pioneering report, we have a refreshing, business-minded approach to understanding
and addressing our nation’s future. Read on…you may be surprised by how much you learn. We
hope you will be motivated to help solve the problem!
iv
www.kpcb.com USA Inc.
Table of Contents
About USA Inc. ∙ ∙ ∙ ∙ ∙ ∙ ∙ ∙ ∙ ∙ ∙ ∙ ∙ ∙ ∙ ∙ ∙ ∙
∙ ∙ ∙ ∙ ∙ ∙ ∙ ∙ ∙ ∙ ∙ ∙ ∙ ∙ ∙ ∙ ∙ ∙ ∙
ii
Foreword ∙ ∙ ∙ ∙ ∙ ∙ ∙ ∙ ∙ ∙ ∙ ∙ ∙ ∙ ∙ ∙ ∙ ∙ ∙ ∙ ∙ ∙ ∙ ∙ ∙ ∙ ∙ ∙ ∙ ∙ ∙ ∙ ∙ ∙ ∙ ∙ ∙ ∙ ∙ ∙ iii
Summary ∙ ∙ ∙ ∙ ∙ ∙ ∙ ∙ ∙ ∙ ∙ ∙ ∙ ∙ ∙ ∙ ∙ ∙ ∙ ∙ ∙ ∙ ∙ ∙ ∙ ∙ ∙ ∙ ∙ ∙ ∙ ∙ ∙ ∙ ∙ ∙ ∙ ∙ ∙ ∙ vii
Introduction ∙ ∙ ∙ ∙ ∙ ∙ ∙ ∙ ∙ ∙ ∙ ∙ ∙ ∙ ∙ ∙ ∙ ∙ ∙ ∙ ∙ ∙ ∙ ∙ ∙ ∙ ∙ ∙ ∙ ∙ ∙ ∙ ∙ ∙ ∙ ∙ ∙ ∙ ∙ 5
High-Level Thoughts on Income Statement/Balance
Sheet ∙ ∙ ∙ ∙ ∙ ∙ ∙ ∙ ∙ ∙ ∙ ∙
25
Income Statement Drilldown ∙ ∙ ∙ ∙ ∙ ∙ ∙ ∙ ∙ ∙ ∙ ∙ ∙ ∙ ∙ ∙ ∙ ∙ ∙ ∙ ∙ ∙ ∙ ∙ ∙ ∙ ∙ ∙ ∙
53
Entitlement Spending ∙ ∙ ∙ ∙ ∙ ∙ ∙ ∙ ∙ ∙ ∙ ∙ ∙ ∙ ∙ ∙ ∙ ∙ ∙ ∙ ∙ ∙ ∙ ∙ ∙ ∙ ∙ ∙ ∙ ∙ ∙
72
Medicaid ∙ ∙ ∙ ∙ ∙ ∙ ∙ ∙ ∙ ∙ ∙ ∙ ∙ ∙ ∙ ∙ ∙ ∙ ∙ ∙ ∙ ∙ ∙ ∙ ∙ ∙ ∙ ∙ ∙ ∙ ∙ ∙ ∙ ∙ ∙ ∙ 94
Medicare ∙ ∙ ∙ ∙ ∙ ∙ ∙ ∙ ∙ ∙ ∙ ∙ ∙ ∙ ∙ ∙ ∙ ∙ ∙ ∙ ∙ ∙ ∙ ∙ ∙ ∙ ∙ ∙ ∙
∙ ∙ ∙ ∙ ∙ ∙ ∙
100
Unemployment Benefits ∙ ∙ ∙ ∙ ∙ ∙ ∙ ∙ ∙ ∙ ∙ ∙ ∙ ∙ ∙ ∙ ∙ ∙ ∙ ∙ ∙ ∙ ∙ ∙ ∙ ∙ ∙ ∙
121
Social Security ∙ ∙ ∙ ∙ ∙ ∙ ∙ ∙ ∙ ∙ ∙ ∙ ∙ ∙ ∙ ∙ ∙ ∙ ∙ ∙ ∙
∙ ∙ ∙ ∙ ∙ ∙ ∙ ∙ ∙ ∙ ∙ ∙
129
Rising Debt Level and Interest Payments ∙ ∙ ∙ ∙ ∙
∙ ∙ ∙ ∙ ∙ ∙ ∙ ∙ ∙ ∙ ∙ ∙ ∙ ∙ ∙ ∙
142
Debt Level ∙ ∙ ∙ ∙ ∙ ∙ ∙ ∙ ∙ ∙ ∙ ∙ ∙ ∙ ∙ ∙ ∙ ∙ ∙ ∙ ∙
∙ ∙ ∙ ∙ ∙ ∙ ∙ ∙ ∙ ∙ ∙ ∙ ∙
145
Effective Interest Rates ∙ ∙ ∙ ∙ ∙ ∙ ∙ ∙ ∙ ∙ ∙ ∙ ∙ ∙ ∙ ∙ ∙ ∙ ∙
∙ ∙ ∙ ∙ ∙ ∙ ∙ ∙ ∙
161
Debt Composition ∙ ∙ ∙ ∙ ∙ ∙ ∙ ∙ ∙ ∙ ∙ ∙ ∙ ∙ ∙ ∙ ∙ ∙ ∙ ∙ ∙ ∙ ∙ ∙ ∙ ∙ ∙ ∙ ∙ ∙ ∙ 168
Periodic Large One-Time Charges ∙ ∙ ∙ ∙ ∙ ∙ ∙ ∙ ∙ ∙ ∙ ∙ ∙ ∙ ∙ ∙ ∙ ∙ ∙ ∙ ∙ ∙ ∙ ∙ 177
TARP ∙ ∙ ∙ ∙ ∙ ∙ ∙ ∙ ∙ ∙ ∙ ∙ ∙ ∙ ∙ ∙ ∙ ∙ ∙ ∙ ∙ ∙ ∙ ∙ ∙ ∙ ∙ ∙ ∙ ∙ ∙ ∙ ∙ ∙ ∙ ∙ ∙ 188
Fannie Mae / Freddie Mac ∙ ∙ ∙ ∙ ∙ ∙ ∙ ∙ ∙ ∙ ∙ ∙ ∙ ∙ ∙ ∙ ∙ ∙ ∙ ∙ ∙ ∙ ∙ ∙ ∙ ∙ 193
ARRA ∙ ∙ ∙ ∙ ∙ ∙ ∙ ∙ ∙ ∙ ∙ ∙ ∙ ∙ ∙ ∙ ∙ ∙ ∙ ∙ ∙ ∙ ∙ ∙ ∙ ∙ ∙ ∙ ∙ ∙ ∙ ∙ ∙ ∙ ∙ ∙ ∙ 200
Balance Sheet Drilldown ∙ ∙ ∙ ∙ ∙ ∙ ∙ ∙ ∙ ∙ ∙ ∙ ∙ ∙ ∙ ∙ ∙ ∙ ∙ ∙ ∙ ∙ ∙ ∙ ∙ ∙ ∙ ∙ ∙ ∙ ∙ 209
v
www.kpcb.com USA Inc.
What Might a Turnaround Expert Consider? ∙ ∙ ∙ ∙ ∙ ∙ ∙
∙ ∙ ∙ ∙ ∙ ∙ ∙ ∙ ∙ ∙ ∙ ∙ ∙ ∙ ∙
221
High-Level Thoughts on How to Turn Around USA Inc.’s Financial Outlook ∙ ∙ ∙ ∙ 237
Focus on Expenses ∙ ∙ ∙ ∙ ∙ ∙ ∙ ∙ ∙ ∙ ∙ ∙ ∙ ∙ ∙ ∙ ∙ ∙ ∙ ∙ ∙ ∙ ∙ ∙
∙ ∙ ∙ ∙ ∙ ∙ ∙ ∙ ∙
253
Reform Entitlement Programs ∙ ∙ ∙ ∙ ∙ ∙ ∙ ∙ ∙ ∙ ∙ ∙ ∙ ∙ ∙ ∙ ∙ ∙ ∙ ∙ ∙ ∙ ∙ ∙ ∙
255
Restructure Social Security ∙ ∙ ∙ ∙ ∙ ∙ ∙ ∙ ∙ ∙ ∙ ∙ ∙ ∙ ∙ ∙ ∙ ∙ ∙ ∙ ∙ ∙ ∙ ∙ 256
Restructure Medicare & Medicaid ∙ ∙ ∙ ∙ ∙ ∙ ∙
∙ ∙ ∙ ∙ ∙ ∙ ∙ ∙ ∙ ∙ ∙ ∙ ∙ ∙
268
Focus on Operating Efficiency ∙ ∙ ∙ ∙ ∙ ∙ ∙ ∙ ∙ ∙ ∙ ∙ ∙ ∙ ∙ ∙ ∙ ∙ ∙ ∙ ∙ ∙ ∙ ∙ ∙
329
Review Wages & Benefits ∙ ∙ ∙ ∙ ∙ ∙ ∙ ∙ ∙ ∙ ∙ ∙ ∙ ∙ ∙ ∙ ∙ ∙ ∙ ∙ ∙ ∙ ∙ ∙ ∙
335
Review Government Pension Plans ∙ ∙ ∙ ∙ ∙ ∙
∙ ∙ ∙ ∙ ∙ ∙ ∙ ∙ ∙ ∙ ∙ ∙ ∙
338
Review Role of Unions ∙ ∙ ∙ ∙ ∙ ∙ ∙ ∙ ∙ ∙ ∙ ∙ ∙ ∙ ∙ ∙ ∙ ∙ ∙ ∙ ∙ ∙ ∙ ∙ ∙ ∙
342
Review Cost Structure & Headcount ∙ ∙ ∙ ∙ ∙ ∙ ∙
∙ ∙ ∙ ∙ ∙ ∙ ∙ ∙ ∙ ∙ ∙ ∙
345
Review Non-Core 'Business' for Out-Sourcing ∙ ∙ ∙ ∙ ∙ ∙ ∙ ∙
∙ ∙ ∙ ∙ ∙ ∙
349
Focus on Revenues ∙ ∙ ∙ ∙ ∙ ∙ ∙ ∙ ∙ ∙ ∙ ∙ ∙ ∙ ∙ ∙ ∙ ∙ ∙ ∙ ∙ ∙ ∙ ∙
∙ ∙ ∙ ∙ ∙ ∙ ∙ ∙ ∙
355
Drive Sustainable Economic Growth ∙ ∙ ∙ ∙ ∙ ∙ ∙
∙ ∙ ∙ ∙ ∙ ∙ ∙ ∙ ∙ ∙ ∙ ∙ ∙ ∙ ∙
356
Invest in Technology / Infrastructure / Education ∙ ∙ ∙ ∙ ∙ ∙ ∙ ∙ ∙ ∙ ∙ ∙ ∙
366
Increase / Improve Employment ∙ ∙ ∙ ∙ ∙ ∙ ∙
∙ ∙ ∙ ∙ ∙ ∙ ∙ ∙ ∙ ∙ ∙ ∙ ∙ ∙ ∙
383
Improve Competitiveness ∙ ∙ ∙ ∙ ∙ ∙ ∙ ∙ ∙ ∙ ∙ ∙ ∙ ∙ ∙ ∙ ∙ ∙ ∙ ∙ ∙ ∙ ∙ ∙ ∙ 389
Consider Changing Tax Policies ∙ ∙ ∙ ∙ ∙ ∙ ∙ ∙ ∙ ∙ ∙ ∙ ∙ ∙ ∙ ∙ ∙ ∙ ∙ ∙ ∙ ∙ ∙ ∙
395
Review Tax Rates ∙ ∙ ∙ ∙ ∙ ∙ ∙ ∙ ∙ ∙ ∙ ∙ ∙ ∙ ∙ ∙ ∙ ∙ ∙ ∙ ∙ ∙ ∙ ∙ ∙ ∙ ∙ ∙ ∙
396
Reduce Subsidies / Tax Expenditures / Broaden Tax Base ∙ ∙ ∙ ∙ ∙ ∙ ∙
400
Consequences of Inaction ∙ ∙ ∙ ∙ ∙ ∙ ∙ ∙ ∙ ∙ ∙ ∙ ∙ ∙ ∙ ∙ ∙ ∙ ∙ ∙ ∙ ∙ ∙ ∙
∙ ∙ ∙ ∙ ∙ ∙ ∙ ∙
413
Short-Term, Long-Term ∙ ∙ ∙ ∙ ∙ ∙ ∙ ∙ ∙ ∙ ∙ ∙ ∙ ∙ ∙ ∙ ∙ ∙ ∙ ∙ ∙ ∙ ∙ ∙
∙ ∙ ∙ ∙ ∙ ∙ ∙
415
Public Debt, Net Worth vs. Peers ∙ ∙ ∙ ∙ ∙ ∙ ∙ ∙ ∙ ∙ ∙ ∙ ∙ ∙ ∙ ∙ ∙ ∙ ∙ ∙ ∙ ∙ ∙ ∙ ∙ ∙
416
Lessons Learned From Historical Debt Crisis ∙ ∙ ∙ ∙ ∙ ∙ ∙
∙ ∙ ∙ ∙ ∙ ∙ ∙ ∙ ∙ ∙ ∙ ∙ ∙
422
General Motors ∙ ∙ ∙ ∙ ∙ ∙ ∙ ∙ ∙ ∙ ∙ ∙ ∙ ∙ ∙ ∙ ∙ ∙ ∙ ∙ ∙ ∙ ∙ ∙
∙ ∙ ∙ ∙ ∙ ∙ ∙ ∙ ∙ ∙ ∙ ∙
431
Summary ∙ ∙ ∙ ∙ ∙ ∙ ∙ ∙ ∙ ∙ ∙ ∙ ∙ ∙ ∙ ∙ ∙ ∙ ∙ ∙ ∙ ∙ ∙ ∙ ∙ ∙ ∙ ∙ ∙ ∙ ∙ ∙ ∙ ∙ ∙ ∙ ∙ ∙ ∙ ∙ ∙
437
Appendix ∙ ∙ ∙ ∙ ∙ ∙ ∙ ∙ ∙ ∙ ∙ ∙ ∙ ∙ ∙ ∙ ∙ ∙ ∙ ∙ ∙ ∙ ∙ ∙ ∙ ∙ ∙ ∙ ∙ ∙ ∙ ∙ ∙ ∙ ∙ ∙ ∙ ∙ ∙ ∙ ∙
453
Glossary ∙ ∙ ∙ ∙ ∙ ∙ ∙ ∙ ∙ ∙ ∙ ∙ ∙ ∙ ∙ ∙ ∙ ∙ ∙ ∙ ∙ ∙ ∙ ∙ ∙ ∙ ∙ ∙ ∙ ∙ ∙ ∙ ∙ ∙ ∙ ∙ ∙ ∙ ∙ ∙ ∙
xix
Index ∙ ∙ ∙ ∙ ∙ ∙ ∙ ∙ ∙ ∙ ∙ ∙ ∙ ∙ ∙ ∙ ∙ ∙ ∙ ∙ ∙ ∙ ∙ ∙ ∙ ∙ ∙ ∙ ∙ ∙ ∙ ∙ ∙ ∙ ∙ ∙ ∙ ∙ ∙ ∙ ∙ ∙ ∙
xxvii
vi
www.kpcb.com USA Inc.
Summary
Imagine for a moment that the United States government is a public corporation. Imagine
that its management structure, fiscal performance, and budget are all up for review. Now
imagine that you’re a shareholder in USA Inc. How do you feel about your investment?
Because 45% of us own shares in publicly traded companies, nearly half the country expects
quarterly updates on our investments. But although 100% of us are stakeholders in the United
States, very few of us look closely at Washington’s financials. If we were long-term investors,
how would we evaluate the federal government’s business model, strategic plans, and operating
efficiency? How would we react to its earnings reports? Nearly two-thirds of all American
households pay federal income taxes, but very few of us take the time to dig into the numbers of
the entity that, on average, collects 13% of our annual gross income (not counting another 15-
30% for payroll and various state and local taxes).
We believe it’s especially important to pay closer attention to one of our most important
investments.
As American citizens and taxpayers, we care about the future of our country. As investors, we’re
in an on-going search for data and insights that will help us make more informed investment
decisions. It’s easier to predict the future if one has a keen understanding of the past, but we
found ourselves struggling to find good information about America’s financials. So we decided to
assemble – in one place and in a user-friendly format – some of the best data about the world’s
biggest “business.” We also provide some historical context for how USA Inc.’s financial model
has evolved over decades. And, as investors, we look at trend lines which help us understand
the patterns (and often future directions) of key financial drivers like revenue and expenses.
The complexity of USA Inc.’s challenges is well known, and our presentation is just a starting
point; it’s far from perfect or complete. But we are convinced that citizens – and investors –
should understand the business of their government. Thomas Jefferson and Alexis de
Tocqueville knew that – armed with the right information – the enlightened citizenry of America
would make the right decisions. It is our humble hope that a transparent financial framework can
help inform future debates.
In the conviction that every citizen should understand the finances of USA Inc. and the plans of
its “management team,” we examine USA Inc.’s income statement and balance sheet and
present them in a basic, easy-to-use format. We summarize our thoughts in PowerPoint form and
in this brief text summary at www.kpcb.com/usainc. We encourage people to take our data and
thoughts and study them, critique them, augment them, share them, and make them better.
There’s a lot of material – think of it as a book that happens to be a slide presentation.
vii
www.kpcb.com USA Inc.
There are two caveats. First, we do not make policy recommendations. We try to help clarify
some of the issues in a straightforward, analytical way. We aim to present data, trends, and facts
about USA Inc.’s key revenue and expense drivers to provide context for how its financials have
reached their present state. Our observations come from publicly available information, and we
use the tools of basic financial analysis to interpret it. Forecasts generally come from 3rd-party
agencies like the Congressional Budget Office (CBO), the nonpartisan federal agency charged
with reviewing the financial impact of legislation. Second, the ‘devil is in the details.’ For US
policy makers, the timing of material changes will be especially difficult, given the current
economic environment.
By the standards of any public corporation, USA Inc.’s financials are discouraging.
True, USA Inc. has many fundamental strengths. On an operating basis (excluding Medicare
and Medicaid spending and one-time charges), the federal government’s profit & loss statement
is solid, with a 4% median net margin over the last 15 years. But cash flow is deep in the red (by
almost $1.3 trillion last year, or -$11,000 per household), and USA Inc.’s net worth is negative
and deteriorating. That net worth figure includes the present value of unfunded entitlement
liabilities but not hard-to-value assets such as natural resources, the power to tax or mint
currency, or what Treasury calls “heritage” or “stewardship assets” like national parks.
Nevertheless, the trends are clear, and critical warning signs are evident in nearly every data
point we examine.
viii
www.kpcb.com USA Inc. | Summary
F2010 Cash Flow = -$1.3 Trillion; Net Worth = -$44 Trillion
With a Negative Trend Line Over Past 15 Years
USA Inc. Annual Cash Flow & Year-End Net Worth, F1996 – F2010
-$1,600
-$1,200
-$800
-$400
$0
$400
F1996 F1998 F2000 F2002 F2004 F2006 F2008 F2010
Annual Cash Flow ($Billion)
-$60,000
-$45,000
-$30,000
-$15,000
$0
$15,000
Year-End Net Worth ($Billion)
One-Time Expenses*
Cash Flow (left axis)
Net Worth (right axis)
Note: USA federal fiscal year ends in September; Cash flow = total revenue – total spending on a cash basis; net worth includes unfunded future liabilities from
Social Security and Medicare on an accrual basis over the next 75 years. *One-time expenses in F2008 include $14B payments to Freddie Mac; F2009
includes $279B net TARP payouts, $97B payment to Fannie Mae & Freddie Mac and $40B stimulus spending on discretionary items; F2010E includes $26B
net TARP income, $137B stimulus spending and $41B payment to Fannie Mae & Freddie Mac. F2010 net worth improved dramatically owing to revised
actuarial estimates for Medicare program resulted from the Healthcare reform legislation. For more definitions, see next slide. Source: cash flow per White
House Office of Management and Budget; net worth per Dept. of Treasury, “2010 Financial Report of the U.S. Government.”
www.kpcb.com USA Inc.
Underfunded entitlements are among the most severe financial burdens USA Inc. faces.
And because some of the most underfunded programs are intended to help the nation’s
poorest, the electorate must understand the full dimensions of the challenges.
Some consider defense outlays – which have nearly doubled in the last decade, to 5% of GDP –
a principal cause of USA Inc.’s financial dilemma. But defense spending is still below its 7%
share of GDP from 1948 to 2000; it accounted for 20% of the budget in 2010, compared with
41% of all government spending between 1789 and 1930. The principal challenges lie
elsewhere. Since the Great Depression, USA Inc. has steadily added “business lines” and, with
the best of intentions, created various entitlement programs. They serve many of the nation’s
poorest, whose struggles have been made worse by the recent financial crisis. Apart from Social
Security and unemployment insurance, however, funding for these programs has been woefully
inadequate – and getting worse.
Entitlement expenses amount to $16,000 per household per year, and entitlement spending far
outstrips funding, by more than $1 trillion (or $9,000 per household) in 2010. More than 35% of
the US population receives entitlement dollars or is on the government payroll, up from ~20% in
1966. Given the high correlation of rising entitlement income with declining savings, do
Americans feel less compelled to save if they depend on the government for their future savings?
It is interesting to note that in China the household savings rate is ~36%, per our estimates
based on CEIC data, in part due to a higher degree of self-reliance – and far fewer established
pension plans. In the USA, the personal savings rate (defined as savings as percent of
disposable income) was 6% in 2010 and only 3% from 2000 to 2008.
www.kpcb.com USA Inc. | Summary
F2010 USA Inc. Revenues + Expenses At A Glance
F2010
Revenues =
$2.2T
10%
9%
40%
41%
Corporate
Income Tax
$191B
Other
$208B
Individual
Income Tax
$899B
Social
Insurance Tax
$865B
Note: USA federal fiscal year ends in September; *individual & corporate income taxes include capital gains taxes. Non-
defense discretionary includes federal spending on education, infrastructure, law enforcement, judiciary functions…
Source: White House Office of Management and Budget.
6%
4%
12%
20%
16%
22%
20%
Defense
$694B
Discretionary
One-Time Items
$152B
F2010 USA Inc. Expenses =
$3.5T
Social
Security
$707B
Medicare +
Federal
Medicaid
$724B
Unemployment Insurance
+ Other Entitlements
$553B
Non-Defense
Discretionary
$431B
Net Interest
Payment
$196B
Entitlement
Programs
ix
www.kpcb.com USA Inc. | Summary
Unfunded Entitlement (Medicare + Social Security) + Underfunded
Entitlement Expenditures (Medicaid) =
Among Largest Long-Term Liabilities on USA Inc.'s Balance Sheet
Unfunded
Medicare
Unfunded
Social
Security
USA Balance Sheet Liabilities Composition, F2010
Note: Medicaid funding is appropriated by Congress (from general tax revenue) on an as-needed basis every year, therefore,
there is no need to maintain a contingency reserve, and, unlike Medicare, the “financial status” of the program is not in question
from an actuarial perspective. Here we estimated the net present value of future Medicaid spending through 2085E, assuming a
3% discount rate. Data source: Dept. of Treasury,
Dept. of Health & Human Services Center for Medicare & Medicaid Services.
Federal
Debt
$3.7T
$9.1T $7.9T
$22.8T
All
Other
$1.6T
Veteran
Benefits
Federal
Employee
Benefits
$2.1T
Medicaid*
$35.3T
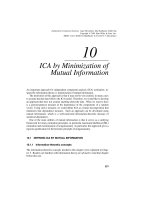
www.kpcb.com USA Inc.
Millions of Americans have come to rely on Medicare and Medicaid – and spending has
skyrocketed, to 21% of USA Inc.’s total expenses (or $724B) in F2010, up from 5% forty
years ago.
Together, Medicaid and Medicare – the programs providing health insurance to low-income
households and the elderly, respectively – now account for 35% of total healthcare spending in
the USA. Since their creation in 1965, both programs have expanded markedly. Medicaid now
serves 16% of all Americans, compared with 2% at its inception; Medicare now serves 15% of
the population, up from 10% in 1966. As more Americans receive benefits and as healthcare
costs continue to outstrip GDP growth, total spending for the two entitlement programs is
accelerating. Over the last decade alone, Medicaid spending has doubled in real terms, with
total program costs running at $273 billion in F2010. Over the last 43 years, real Medicare
spending per beneficiary has risen 25 times, driving program costs well (10x) above original
projections. In fact, Medicare spending exceeded related revenues by $272 billion last year.
Amid the rancor about government’s role in healthcare spending, one fact is undeniable:
government spending on healthcare now consumes 8.2% of GDP, compared with just
1.3% fifty years ago.
The overall healthcare funding mix in the US is skewed toward private health insurance due to
the predominance of employer-sponsored funding (which covers 157MM working Americans and
their families, or 58% of the total population in 2008 vs. 64% in 1999). This mixed private-public
funding scheme has resulted in implicit cross-subsidies, whereby healthcare providers push
www.kpcb.com USA Inc. | Summary
0%
2%
4%
6%
8%
1960 1964 1968 1972 1976 1980 1984 1988 1992 1996 2000 2004 2008
Spending as % of GDP
Total Government (Federal + State + Local) Spending on Healthcare
Total Government (Federal + State + Local) Spending on Education
Note: *Total government spending on healthcare includes Medicare, Medicaid and other programs such as federal
employee and veteran health benefits; total government spending on education includes spending on pre-primary through
tertiary education programs. Source: Dept. of Education, Dept. of Health & Human Services.
Total Government* Healthcare Spending Increases are Staggering –
Up 7x as % of GDP Over Five Decades vs. Education Spending Only Up 0.6x
USA Total Government Healthcare vs. Education Spending as % of GDP, 1960 – 2009
8.2%
1.2%
x
www.kpcb.com USA Inc.
costs onto the private market to help subsidize lower payments from public programs. This
tends to help drive a cycle of higher private market costs causing higher insurance premiums,
leading to the slow erosion of private market coverage and a greater enrollment burden for
government programs.
The Patient Protection and Affordable Care Act, enacted in early 2010, includes the biggest
changes to healthcare since 1965 and will eventually expand health insurance coverage by
~10%, to 32 million new lives. Increased access likely means higher spending if healthcare
costs continue to grow 2 percentage points faster than per capita income (as they have over the
past 40 years). The CBO sees a potential $143B reduction in the deficit over the next 10 years,
but this assumes that growth in Medicare costs will slow – an assumption the CBO admits is
highly uncertain.
Unemployment Insurance and Social Security are adequately funded for now. Their
future, unfortunately, isn’t so clear.
Unemployment Insurance is cyclical and, apart from the 2007-09 recession, generally operates
with a surplus. Payroll taxes kept Social Security mainly at break-even until 1975-81 when
expenses began to exceed revenue. Reforms that cut average benefits by 5%, raised tax rates
by 2.3%, and increased the full retirement age by 3% (to 67) restored the system’s stability for
the next 25 years, but the demographic outlook is poor for its pay-as-you-go funding structure. In
1950, 100 workers supported six beneficiaries; today, 100 workers support 33 beneficiaries.
Since Social Security began in 1935, American life expectancy has risen 26% (to 78), but the
“retirement age” for full benefits has increased only 3%.
Regardless of the emotional debate about entitlements, fiscal reality can’t be ignored – if
these programs aren’t reformed, one way or another, USA Inc.’s balance sheet will go
from bad to worse.
xi
www.kpcb.com USA Inc. | Summary
0%
5%
10%
15%
20%
25%
30%
35%
40%
1790 1810 1830 1850 1870 1890 1910 1930 1950 1970 1990 2010
Federal Spending as % of GDP
Federal Government Spending as % of GDP, 1790 – 2010
Source: Federal spending per Series Y 457-465 in "Historical Statistics of the United States, Colonial Times to 1970, Part II“ and per
White House OMB. GDP prior to 1930 per Louis Johnston and Samuel H. Williamson, "What Was the U.S. GDP Then?"
MeasuringWorth, 2010. GDP post 1930 per White House OMB. Neither federal spending nor GDP data are adjusted for inflation.
Federal Government Spending Had Risen to 24% of GDP in 2010,
Up From an Average of 3% From 1790 to 1930
3% Trendline Average
1790-1930
24% in 2010
www.kpcb.com USA Inc.
Take a step back, and imagine what the founding fathers would think if they saw how our
country’s finances have changed. From 1790 to 1930, government spending on average
accounted for just 3% of American GDP. Today, government spending absorbs closer to 24% of
GDP.
It’s likely that they would be even more surprised by the debt we have taken on to pay for this
expansion. As a percentage of GDP, the federal government’s public debt has doubled over the
last 30 years, to 53% of GDP. This figure does not include claims on future resources from
underfunded entitlements and potential liabilities from Fannie Mae and Freddie Mac, the
Government Sponsored Enterprises (GSEs). If it did include these claims, gross federal debt
accounted for 94% of GDP in 2010. The public debt to GDP ratio is likely to triple to 146% over
the next 20 years, per CBO. The main reason is entitlement expense. Since 1970, these costs
have grown 5.5 times faster than GDP, while revenues have lagged, especially corporate tax
revenues. By 2037, cumulative deficits from Social Security could add another $11.6 trillion to
the public debt.
The problem gets worse. Even as USA Inc.’s debt has been rising for decades, plunging interest
rates have kept the cost of supporting it relatively steady. Last year’s interest bill would have
been 155% (or $290 billion) higher if rates had been at their 30-year average of 6% (vs. 2% in
2010). As debt levels rise and interest rates normalize, net interest payments could grow 20% or
more annually. Below-average debt maturities in recent years have also kept the Treasury’s
borrowing costs down, but this trend, too, will drive up interest payments once interest rates rise.
www.kpcb.com USA Inc. | Summary
0%
200%
400%
600%
800%
1000%
1200%
1965 1969 1973 1977 1981 1985 1989 1993 1997 2001 2005 2009
% Change From 1965
Total Expenses
Entitlement Programs
Real GDP
USA Real Federal Expenses, Entitlement Spending, Real GDP % Change, 1965 – 2010
Note: Data adjusted for inflation. Source: White House Office of Management and Budget.
Entitlement
Expenses
+10.6x
Real GDP
+2.7x
Total
Expenses
+3.3x
Entitlement Spending Increased 11x
While Real GDP Grew 3x
Over Past 45 Years
xii
www.kpcb.com USA Inc.
Can we afford to wait until the turning point comes? By 2025, entitlements plus net
interest payments will absorb all – yes, all – of USA Inc.'s revenue, per CBO.
Less than 15 years from now, in other words, USA Inc. – based on current forecasts for revenue
and expenses - would have nothing left over to spend on defense, education, infrastructure, and
R&D, which today account for only 32% of USA Inc. spending, down from 69% forty years ago.
This critical juncture is getting ever closer. Just ten years ago, the CBO thought federal revenue
would support entitlement spending and interest payments until 2060 – 35 years beyond its
current projection. This dramatic forecast change over the past ten years helps illustrate, in our
view, how important it is to focus on the here-and-now trend lines and take actions based on
those trends.
How would a turnaround expert determine ‘normal’ revenue and expenses?
The first step would be to examine the main drivers of revenue and expenses. It’s not a pretty
picture. While revenue – mainly taxes on individual and corporate income – is highly correlated
(83%) with GDP growth, expenses – mostly entitlement spending – are less correlated (73%)
with GDP. With that as backdrop, our turnaround expert might try to help management and
shareholders (citizens) achieve a long-term balance by determining “normal” levels of revenue
and expenses:
www.kpcb.com USA Inc. | Summary
Entitlement Spending + Interest Payments Alone Should
Exceed USA Inc. Total Revenue by 2025E, per CBO
Entitlement Spending + Interest Payments vs. Revenue as % of GDP, 1980 – 2050E
0%
10%
20%
30%
40%
1980 1990 2000 2010E 2020E 2030E 2040E 2050E
Total Revenue & Entitlement + Net Interest
Payments as % of GDP
Revenue
Entitlement Spending + Net
Interest Payments
Source: Congressional Budget Office (CBO) Long-Term Budget Outlook (6/10). Note that entitlement spending includes federal government expenditures on Social
Security, Medicare and Medicaid. Data in our chart is based on CBO’s ‘alternative fiscal scenario’ forecast, which assumes a continuation of today’s underlying
fiscal policy. Note that CBO also maintains an ‘extended-baseline’ scenario, which adheres closely to current law. The alternative fiscal scenario deviates from
CBO’s baseline because it incorporates some policy changes that are widely expected to occur (such as extending the 2001-2003 tax cuts rather than letting them
expire as scheduled by current law and adjusting physician payment rates to be in line with the Medicare economic index rather than at lower scheduled rates) and
that policymakers have regularly made in the past.
xiii
www.kpcb.com USA Inc.
• From 1965 to 2005 (a period chosen to exclude abnormal trends related to the recent
recession), annual revenue growth (3%) has been roughly in line with GDP growth, but
corporate income taxes have grown 2% a year. Social insurance taxes grew 5% annually and
represented 37% of USA Inc. revenue, compared with 19% in 1965. An expert might ask:
o What level of social insurance or entitlement taxes can USA Inc. support without reducing
job creation?
o Are low corporate income taxes important to global competitive advantage and stimulating
growth?
• Entitlement spending has risen 5% a year on average since 1965, well above average annual
GDP growth of 3%, and now absorbs 51% of all expenses, more than twice its share in 1965.
Defense and non-defense discretionary spending (including infrastructure, education, and law
enforcement) is up just 1-2% annually over that period. Questions for shareholders:
o Do USA Inc.’s operations run at maximum efficiency? Where are the opportunities for cost
savings?
o Should all expense categories be benchmarked against GDP growth? Should some grow
faster or slower than GDP? If so, what are the key determinants?
o Would greater investment in infrastructure, education, and global competitiveness yield
more long-term security for the elderly and disadvantaged?
With expenses outstripping revenues by a large (and growing) margin, a turnaround expert
would develop an analytical framework for readjusting USA Inc.’s business model and strategic
plans. Prudence would dictate that our expert assume below-trend GDP growth and above-trend
unemployment, plus rising interest rates – all of which would make the base case operating
scenario fairly gloomy.
This analysis can’t ignore our dependence on entitlements. Almost one-third of all
Americans have grown up in an environment of lean savings and heavy reliance on
government healthcare subsidies. It’s not just a question of numbers – it’s a question of
our responsibilities as citizens…and what kind of society we want to be.
Some 90 million Americans (out of a total population of 307 million) have grown accustomed to
support from entitlement programs; so, too, have 14 million workers in the healthcare industry
who, directly or indirectly, benefit from government subsidies via Medicare and Medicaid. Low
personal savings and high unemployment make radical change difficult. Political will can be
difficult to summon, especially during election campaigns.
xiv
www.kpcb.com USA Inc.
At the same time, however, these numbers don’t lie. With our demographics and our
debts, we’re on a collision course with the future. The good news: Although time is
growing short, we still have the capacity to create positive outcomes.
Even though USA Inc. can print money and raise taxes, USA Inc. cannot sustain its financial
imbalance indefinitely – especially as the Baby Boomer generation nears retirement age. Net
debt levels are approaching warning levels, and some polls suggest that Americans consider
reducing debt a national priority. Change is legally possible. Unlike underfunded pension
liabilities that can bankrupt companies, USA Inc.’s underfunded liabilities are not legal contracts.
Congress has the authority to change the level and conditions for Social Security and Medicare
benefits; the federal government, together with the states, can also alter eligibility and benefit
levels for Medicaid.
Options for entitlement reform, operating efficiency, and stronger long-term GDP growth.
As analysts, not public policy experts, we can offer mathematical illustrations as a framework for
discussion (not necessarily as actual solutions). We also present policy options from third-party
organizations such as the CBO.
Reforming entitlement programs – Social Security.
The underfunding could be addressed through some or all of the following mechanical changes:
increasing the full retirement age to as high as 73 (from the current level of 67); and/or reducing
average annual social security benefits by up to 12% (from $13,010 to $11,489); and/or
increasing the social security tax rate from 12.4% to 14.2%. Options proposed by the CBO
include similar measures, as well as adjustments to initial benefits and index levels. Of course,
the low personal savings rates of average Americans – 3% of disposable income, compared with
a 10% average from 1965 to 1985 – limit flexibility, at least in the early years of any reform.
Reforming entitlement programs – Medicare and Medicaid.
Mathematical illustrations for these programs, the most underfunded, seem draconian: Reducing
average Medicare benefits by 53%, to $5,588 per year, or increasing the Medicare tax rate by
3.9 percentage points, to 6.8%, or some combination of these changes would address the
underfunding of Medicare. As for Medicaid, the lack of a dedicated funding stream (i.e., a tax
similar to the Medicare payroll tax) makes the math even more difficult. But by one measure
from the Kaiser Family Foundation, 60% of the Medicaid budget in 2001 was spent on so-called
optional recipients (such as mid- to low-income population above poverty level) or on optional
services (such as dental services and prescription drug benefits). Reducing or controlling these
benefits could help control Medicaid spending – but increase the burden on some poor and
disabled groups.
Ultimately, the primary issue facing the US healthcare system is ever-rising costs, historically
driven by increases in price and utilization. Beneath sustained medical cost inflation is an
entitlement mentality bolted onto a volume-based reimbursement scheme. All else being equal,
the outcome is an incentive to spend: Underlying societal, financial, and liability factors combine
to fuel an inefficient, expensive healthcare system.
xv
www.kpcb.com USA Inc.
Improving operating efficiency.
With nearly one government civilian worker (federal, state and local) for every six households,
efficiency gains seem possible. A 20-year trend line of declining federal civilian headcount was
reversed in the late 1990s.
Resuming that trend would imply a 15% potential headcount reduction over five years and save
nearly $300 billion over the next ten years. USA Inc. could also focus intensively on local private
company outsourcing, where state and local governments are finding real productivity gains.
Improving long-term GDP growth – productivity and employment.
Fundamentally, federal revenues depend on GDP growth and related tax levies on consumers
and businesses. Higher GDP growth won’t be easy to achieve as households rebuild savings in
the aftermath of a recession. To break even without changing expense levels or tax policies,
USA Inc. would need real GDP growth of 6-7% in F2012-14 and 4-5% in F2015-20, according to
our estimates based on CBO data – highly unlikely, given 40-year average GDP growth of 3%.
While USA Inc. could temporarily increase government spending and investment to make up for
lower private demand in the near term, the country needs policies that foster productivity and
employment gains for sustainable long-term economic growth.
Productivity gains and increased employment each contributed roughly half of the long-term
GDP growth between 1970 and 2009, per the National Bureau of Economic Research. Since the
1960s, as more resources have gone to entitlements and interest payments, USA Inc. has
scaled back its investment in technology R&D and infrastructure as percentages of GDP.
Competitors are making these investments. India plans to double infrastructure spending as a
percent of GDP by 2013, and its tertiary (college) educated population will double over the next
ten years, according to Morgan Stanley analysts, enabling its GDP growth to accelerate to 9-
10% annually by 2015 (China’s annual GDP growth is forecast to remain near 8% by 2015).
USA Inc. can’t match India’s demographic advantage, but technology can help.
www.kpcb.com USA Inc. | Summary
-4%
-2%
0%
2%
4%
6%
8%
2009 2011E 2013E 2015E 2017E 2019E
Real GDP Y/Y Growth (%)
Real GDP Annual Growth (CBO Baseline Forecast)
Real GDP Annual Growth Needed to Eliminate Fiscal Deficit
1970-2009 Average Real GDP Growth
CBO’s Baseline Real GDP Growth vs. Required Real GDP
Growth for a Balanced Budget Between F2011E and F2020E
Source: CBO, “The Budget and Economic Outlook: Fiscal Years 2010 to 2020,” 8/10.
How Much Would Real GDP Need to Grow to Drive USA Inc. to Break-Even
Without Policy Changes? 6-7% in F2012E-F2014E & 4-5% in F2015-
F2020E…Well Above 40-Year Average of 3%
xvi
www.kpcb.com USA Inc.
For employment gains, USA Inc. should minimize tax and regulatory uncertainties and
encourage businesses to add workers. While hiring and R&D-related tax credits may add to
near-term deficits, over time, they should drive job and GDP growth. Immigration reform could
also help: A Federal Reserve study in 2010 shows that immigration does not take jobs from
U.S born workers but boosts productivity and income per worker.
Changing tax policies.
Using another simple mechanical illustration, covering the 2010 budget deficit (excluding one-
time charges) by taxes alone would mean doubling individual income tax rates across the board,
to roughly 26-30% of gross income, we estimate. Such major tax increases would ultimately be
self-defeating if they reduce private income and consumption. However, reducing tax
expenditures and subsidies such as mortgage interest deductions would broaden the tax base
and net up to $1.7 trillion in additional revenue over the next decade, per CBO. A tax based on
consumption - like a value added tax (VAT) - could also redirect the economy toward savings
and investment, though there would be drawbacks.
These issues are undoubtedly complex, and difficult decisions must be made. But
inaction may be the greatest risk of all. The time to act is now, and our first responsibility
as investors in USA Inc. is to understand the task at hand.
Our review finds serious challenges in USA Inc.’s financials. The ‘management team’ has
created incentives to spend on healthcare, housing, and current consumption. At the margin,
investing in productive capital, education, and technology – the very tools needed to compete in
the global marketplace – has stagnated.
www.kpcb.com USA Inc. | Summary
America’s Resources Allocated to Housing + Healthcare Nearly Doubled as a Percent
of GDP Since 1965, While Household and Government Savings Fell Dramatically
Healthcare + Housing Spending vs. Net Household +
Government Savings as % of GDP, 1965-2009
Note: Housing includes purchase, rent and home improvement. Government savings occur when government runs a surplus.
Source
: BEA, CMS via Haver Analytics.
-10%
-5%
0%
5%
10%
15%
20%
25%
1965 1970 1975 1980 1985 1990 1995 2000 2005
As % of GDP
Housing + Healthcare Spending as % of GDP
Net Household + Government Savings as % of GDP
11%
20%
7%
-9%
xvii
www.kpcb.com USA Inc.
With these trends, USA Inc. will not be immune to the sudden crises that have afflicted others
with similar unfunded liabilities, leverage, and productivity trends. The sovereign credit issues in
Europe suggest what might lie ahead for USA Inc. shareholders – and our children. In effect,
USA Inc. is maxing out its credit card. It has fallen into a pattern of spending more than it earns
and is issuing debt at nearly every turn. Common principles for overcoming this kind of burden
include the following:
1) Acknowledge the problem – some 80% of Americans believe ‘dealing with our growing
budget deficit and national debt’ is a national priority, according to a Peter G. Peterson
Foundation survey in 11/09;
2) Examine past errors – People need clear descriptions and analysis to understand how the
US arrived at its current financial condition – a ‘turnaround CEO’ would certainly initiate a
‘no holds barred’ analysis of the purpose, success and operating efficiency of all of USA
Inc.’s spending;
3) Make amends for past errors – Most Americans today at least acknowledge the problems
at personal levels and say they rarely or never spend more than what they can afford (63%
according to a 2007 Pew Research study). The average American knows the importance
of managing a budget. Perhaps more would be willing to sacrifice for the greater good with
an understandable plan to serve the country’s long-term best interests;
4) Develop a new code of behavior – Policymakers, businesses (including investment firms),
and citizens need to share responsibility for past failures and develop a plan for future
successes.
Past generations of Americans have responded to major challenges with collective
sacrifice and hard work. Will ours also rise to the occasion?
xviii
www.kpcb.com USA Inc.
USA Inc. – Outline
Introduction
1
High-Level Thoughts on Income Statement/Balance Sheet
2
Income Statement Drilldown
3
Balance Sheet Drilldown
4
What Might a Turnaround Expert – Empowered to Improve
USA Inc.’s Financials – Consider?
5
Consequences of Inaction
6
Summary
7
Appendix
8
2
www.kpcb.com USA Inc.
This work is licensed for non-commercial distribution (but NOT for excerpting, or modifying or creating derivatives) under the Creative Commons
Attribution-NonCommercial-NoDerivs 3.0 Unported CC BY-NC-ND license. You can find this license at />nd/3.0/legalcode or send a letter to Creative Commons, 171 Second Street, Suite 300, San Francisco, CA, 94105, USA.
3
www.kpcb.com USA Inc.
This page is intentionally left blank.
4
www.kpcb.com USA Inc. | Introduction
Introduction
5
www.kpcb.com USA Inc. | Introduction
6
xAbout This Report
www.kpcb.com USA Inc. | Introduction
Presentation Premise
x For America to remain the great country it has been for the past 235 years,
it must determine the best ways to honor the government’s fundamental
mission derived from the Constitution:
x …to form a more perfect union, establish justice, insure domestic tranquility,
provide for the common defense, promote the general welfare and secure the
blessings of liberty to ourselves and our posterity.
x To this end, government should aim to help create a vibrant environment for
economic growth and productive employment. It should manage its operations
and programs as effectively and efficiently as possible, improve its financial
position by driving the federal government’s income statement to long-term
break-even, and reduce the unsustainable level of debt on its balance sheet.
7
www.kpcb.com USA Inc. | Introduction
USA Inc. Concept
Healthy financials and compelling growth prospects are key to success for businesses
(and countries). So if the US federal government – which we call USA Inc. – were a
business, how would public shareholders view it? How would long-term investors evaluate
the federal government’s business model, strategic plans, and operating efficiency? How
would analysts react to its earnings reports? Although some 45%
1
of American households
own shares in publicly traded companies and receive related quarterly financial statements, not
many “stakeholders” look closely at Washington’s financials. Nearly two-thirds of all American
households
2
pay federal income taxes, but very few take the time to dig into the numbers of the
entity that, on average, collects 13%
3
of all Americans’ annual gross income (not counting
another 15-30% for payroll and various state and local taxes).
We drill down on USA Inc.’s past, present, and (in some cases) future financial dynamics and
focus on the country’s income statement and balance sheet and related trends. We isolate and
review key expense and revenue drivers. On the expense side, we examine the major
entitlement programs (Medicare, Medicaid and Social Security) as well as defense and other
major discretionary programs. On the revenue side, we focus on GDP growth (driven by labor
productivity and employment in the long run) and tax policies.
We present basic numbers-driven scenarios for addressing USA Inc.'s financial challenges. In
addition, we lay out the type of basic checklists that corporate turnaround experts might use as
starting points when looking at some of USA Inc.’s business model challenges.
Source: 1) 2008 ICI (Investment Company Institute) / SIFMA (Securities Industry and Financial Markets Association) Equity
and Bond Owners Survey; 2) Number of tax returns with positive tax liability (91MM) divided by total number of returns filed (142MM), per Tax Foundation
calculations based on IRS data; 3) Total federal income taxes (ex. payroll taxes) paid divided by total adjusted gross income, per IRS 2007 data.
8
www.kpcb.com USA Inc. | Introduction
Why We Wrote This Report
As American citizens / tax payers, we care about the future of our country.
As investors, we search for data and insights to help us make better
investment decisions. (It’s easier to predict the future with a keen
understanding of the past.)
We found ourselves searching for better information about the state of America’s
financials, and we decided to assemble – in one place and in a user-friendly format
– some of the best data about the world’s biggest “business.” In addition, we have
attempted to provide some historical context for how USA Inc.’s financial model has
evolved over decades.
The complexity of USA Inc.’s challenges is well known, and our presentation is just
a starting point; it’s far from perfect or complete. But we are convinced that citizens
– and investors – should understand the business of their government. Thomas
Jefferson and Alexis de Tocqueville knew that – armed with the right information –
the enlightened citizenry of America would make the right decisions. It is our
humble hope that a transparent financial framework can help inform future debates.
9
www.kpcb.com USA Inc. | Introduction
What You’ll Find Here…
In the conviction that every citizen should understand the finances of
USA Inc. and the plans of its “management team,” we examine USA Inc.’s
income statement and balance sheet and present them in a basic, easy-to-
use format.
In this document, a broad group of people helped us drill into our federal
government’s basic financial metrics. We summarize our thoughts in PowerPoint
form here and also have provided a brief text summary at www.kpcb.com/usainc.
We encourage people to take our data and thoughts and study them, critique them,
augment them, share them, and make them better. There’s a lot of material – think
of it as a book that happens to be a slide presentation.
10
www.kpcb.com USA Inc. | Introduction
…And What You Won’t
We do not make policy recommendations. We try to help clarify some of the
issues in a simple, analytically-based way. We aim to present data, trends, and
facts about USA Inc.’s key revenue and expense drivers to provide context for
how its financials have reached their present state.
We did not base this analysis on proprietary data. Our observations come
from publicly available information, and we use the tools of basic financial
analysis to interpret it. Forecasts generally come from 3rd-party agencies like the
Congressional Budget Office (CBO). For US policy makers, the timing of material
changes will be especially difficult, given the current economic environment.
No doubt, there will be compliments and criticism of things in the
presentation (or missing from it). We hope that this report helps advance the
discussion and we welcome others to opine with views (backed up by data).
11
www.kpcb.com USA Inc. | Introduction
We Focus on Federal,
Not State & Local Government Data
Note: 1) Per National Conference of State Legislatures, State fiscal years ends in June. $70B aggregate excludes deficits
from Puerto Rico ($3B deficits in F2009). 2) Debt-to-GDP ratio per Census Bureau State & Local Government Finance; 3)
Calculation based on the claim that $1T of collective short fall in State & local government pension and OPEB funding
would be $2.5T using corporate accounting rules, per Orin S. Kramer, “How to Cheat a Retirement Fund,” 9/10.
x Federal / State & Local Governments Share Different Responsibilities
Federal government is financially responsible for all or the majority of Defense, Social
Security, Medicare and Interest Payments on federal debt and coordinates / shares
funding for public investment in education / infrastructure.
State & local governments are financially responsible for all or the majority of Education,
Transportation (Road Construction & Maintenance), Public Safety (Police / Fire
Protection / Law Courts / Prisons) and Environment & Housing (Parks & Recreation /
Community Development / Sewerage & Waste Management).
Federal / state & local governments share financial responsibility in Medicaid and
Unemployment Insurance.
x We Focus on the Federal Government
State and local governments face many similar long-term financial challenges and may
ultimately require federal assistance. To be sure, the size of state & local government
budget deficits ($70 billion
1
in aggregate in F2009) and debt-to-GDP ratio (7%
2
on
average in F2008) pales by comparison to the federal government’s ($1.3 trillion budget
deficit, 62% debt-to-GDP ratio in F2010). But these metrics may understate state & local
governments’ financial challenges by 50% or more
3
because they exclude the long-term
cost of public pension and other post employment benefit (OPEB) liabilities.
12
www.kpcb.com USA Inc. | Introduction
xSummary
13
www.kpcb.com USA Inc. | Introduction
Highlights from F2010 USA Inc. Financials
x Summary – USA Inc. has challenges.
x Cash Flow – While recession depressed F2008-F2010 results, cash flow has been negative
for 9 consecutive years ($4.8 trillion, cumulative), with no end to losses in sight. Negative
cash flow implies that USA Inc. can't afford the services it is providing to 'customers,' many
of whom are people with few alternatives.
x Balance Sheet – Net worth is negative and deteriorating.
x Off-Balance Sheet Liabilities – Off-balance sheet liabilities of at least $31 trillion (primarily
unfunded Medicare and Social Security obligations) amount to nearly $3 for every $1 of debt
on the books. Just as unfunded corporate pensions and other post-employment benefits
(OPEB) weigh on public corporations, unfunded entitlements, over time, may increase USA
Inc.’s cost of capital. And today’s off-balance sheet liabilities will be tomorrow’s on-balance
sheet debt.
x Conclusion – Publicly traded companies with similar financial trends would be pressed by
shareholders to pursue a turnaround. The good news: USA Inc.’s underlying asset base and
entrepreneurial culture are strong. The financial trends can shift toward a positive direction,
but both ‘management’ and ‘shareholders’ will need collective focus, willpower, commitment,
and sacrifice.
Note: USA federal fiscal year ends in September; Cash flow = total revenue – total spending on a cash basis; net worth includes
unfunded future liabilities from Social Security and Medicare on an accrual basis over the next 75 years. Source: cash flow per
White House Office of Management and Budget; net worth per Dept. of Treasury, “2010 Financial Report of the U.S.
Government,” adjusted to include unfunded liabilities of Social Security and Medicare.
14