Tài liệu HPLC for Pharmaceutical Scientists 2007 (Part 20) pdf
Bạn đang xem bản rút gọn của tài liệu. Xem và tải ngay bản đầy đủ của tài liệu tại đây (627.47 KB, 36 trang )
20
LC-NMR O
VERVIEW AND
PHARMACEUTICAL APPLICATIONS*
Maria Victoria Silva Elipe
20.1 INTRODUCTION
The most widely used analytical separation technique for the qualitative
and quantitative determination of chemical mixtures in solution in the
pharmaceutical industry is high-performance liquid chromatography (HPLC).
However, conventional detectors used to monitor the separation, such as UV,
refractive index, fluorescence, and radioactive detectors, provide limited infor-
mation on the molecular structure of the components of the mixture. Mass
spectrometry (MS) and nuclear magnetic resonance (NMR) are the primary
analytical techniques that provide structural information on the analytes.
NMR is widely recognized as one of the most important methods of structural
elucidation, but it becomes cumbersome for the analysis of complex mixtures
that require time-consuming sample purification before the NMR analysis.
During the last two decades, hyphenated analytical techniques have grown
rapidly and have been applied successfully to many complex analytical prob-
lems in the pharmaceutical industry.The combination of separation technolo-
gies with spectroscopic techniques is extremely powerful in carrying out
qualitative and quantitative analysis of unknown compounds in complex
matrices in all the stages of drug discovery, development, production, and
manufacturing in the pharmaceutical industry. The HPLC (or LC) and MS
(LC-MS) or NMR (LC-NMR) interface increases the capability of solving
901
HPLC for Pharmaceutical Scientists, Edited by Yuri Kazakevich and Rosario LoBrutto
Copyright © 2007 by John Wiley & Sons, Inc.
*This chapter is an update reprinted from the reference 40, reprinted with permission from
Elsevier, copyright 2003.
structural problems of mixtures of unknown compounds. LC-MS has been one
of the most extensively applied hyphenated techniques for complex mixtures
because MS is more compatible with HPLC and has higher sensitivity than
NMR [1–3].
Recent advances in NMR technology have made NMR more
compatible with HPLC and MS and have enabled LC-NMR and even LC-
MS-NMR (or LC-NMR-MS or LC-NMR/MS) to become routine analytical
tools in many laboratories in the pharmaceutical environment. The present
chapter provides an overview of the LC-NMR and LC-MS-NMR hyphenated
analytical techniques with (a) a description of their limitations together with
examples of LC-NMR and LC-MS-NMR to illustrate the data generated by
these hyphenated techniques and (b) extensive references toward the appli-
cation in the pharmaceutical industry (drug discovery, drug metabolism, drug
impurities, degradation products, natural products, food analysis, and pharma-
ceutical research). This chapter is not meant to imply that LC-MS-NMR will
replace LC-MS, LC-NMR, or NMR techniques for structural elucidation of
compounds. LC-MS-NMR together with LC-MS, LC-NMR, and NMR are
techniques that should be available and applied in appropriate cases based on
their advantages and limitations.
20.2 HISTORICAL BACKGROUND OF NMR
The first part of this section (Section 20.2.1) will provide the reader with his-
torical overview of NMR and with a brief description of the most typical
experiments used in NMR for the structural elucidation of organic com-
pounds. The second part of this section (Section 20.2.2) will focus mainly on
the improvements carried out in the NMR as a hyphenated analytical tech-
nique for the elucidation of organic compounds and an understanding of the
need to develop LC-NMR for the analysis of complex mixtures.
20.2.1 Historical Development of NMR
In 1945 NMR signals in condensed phases were detected by the physicists
Bloch [4] at Stanford and Purcell [5] at Harvard, who received the first Nobel
Prize in NMR. Work on solids dominated the early years of NMR because of
the limitations of the instruments and the incomplete development of theory.
Work in liquids was confined to relaxation studies. A later development was
the discovery of the chemical shift and the spin–spin coupling constant. In 1951
the proton spectrum of ethanol with three distinct resonances showed the
potential of NMR for structure elucidation of organic compounds [6]. Scalar
coupling provides information on spins that are connected by bonds. Spin
decoupling or double resonance, which removes the spin–spin splitting by a
second radiofrequency field, was developed to obtain information about the
scalar couplings in molecules by simplifying the NMR spectrum [7]. Initial
manipulation of the nuclear spin carried out by Hahn [8] was essential for
further development of experiments such as insensitive nuclei enhanced by
902 LC-NMR OVERVIEW AND PHARMACEUTICAL APPLICATIONS
polarization transfer (INEPT) [9], which is the basis of many modern pulse
sequence experiments
. During the 1960s and 1970s the development of super-
conducting magnets and computers improved the sensitivity and broadened
the applications of the NMR spectrometers. The Fourier transform (FT) tech-
nique was implemented in the instruments by Anderson and Ernst [10] in the
1960s, but it took time to become the standard method of acquiring spectra.
Another milestone which increased the signal-to-noise (S/N) ratio was the dis-
covery of the nuclear Overhauser effect (NOE) by Overhauser [11], which
improves the S/N in less sensitive nuclei by polarization transfer. The three-
fold enhancement generally observed for the weak carbon-13 (
13
C) signals was
a major factor in stimulating research on this important nuclide. Several years
later, the proton–proton Overhauser effect was applied to identify protons
that are within 5Å of each other. In the 1970s Ernst [12] implemented the idea
of acquiring a two-dimensional (2D) spectrum by applying two separate
radiofrequency pulses with different increments between the pulses, and after
two Fourier transformations the 2D spectrum was created. Two-dimensional
experiments opened up a new direction for the development of NMR, and
Ernst obtained the second Nobel Prize in NMR in 1991. 2D correlation exper-
iments are of special value because they connect signals through bonds. Exam-
ples of these correlation experiments are correlation spectroscopy (COSY)
[12], total correlation spectroscopy (TOCSY) [13], heteronuclear correlation
spectroscopy (HETCOR) [14], and variations. Other 2D experiments such
as nuclear Overhauser effect spectroscopy (NOESY) [15] and rotating
frame Overhauser effect spectroscopy (ROESY) [16] provide information on
protons that are connected through space to establish molecular conforma-
tions. In 1979 Müller [17] developed a novel 2D experiment that correlates the
chemical shift of two spins, one with a strong and the other with weak mag-
netic moment. Initially the experiment was applied to detect the weak
15
N
nuclei in proteins, but was later modified to detect the chemical shift of
13
C
nuclei through the detection of the protons attached directly to the carbons
[18]. The heteronuclear multiple quantum correlation (HMQC) experiment
gives the same data as the HETCOR, but with greater sensitivity. Heteronu-
clear single quantum correlation (HSQC) [19] is another widely used experi-
ment that provides the same information as the HMQC and uses two
successive INEPT sequences to transfer the polarization from protons to
13
C
or
15
N. Heteronuclear multiple bond correlation (HMBC) [20] experiment
gives correlations through long-range couplings, which allows two and three
1
H–
13
C connectivities to be observed for organic compounds. In 1981 a 2D
incredible natural abundance double quantum transfer experiment (INADE-
QUATE) [21] was developed and defines all the carbon–carbon bonds, thus
establishing the complete carbon skeleton in a single experiment. However,
due to the low natural abundance of adjacent
13
C nuclei, this experiment is not
very practical. All of these experiments became available with the develop-
ment of computers in the 1980s. With the accelerated improvements in elec-
tronics, computers, and software in the 1990s, the use of the pulsed field
HISTORICAL BACKGROUND OF NMR 903
gradients as part of the pulse sequences was developed [22] and applied to
improve solvent suppression and to decrease the time required to acquire 2D
experimental data.
T
his brief historical introduction is intended to give a simplified overview
of some of the critical milestones of NMR mainly in chemical applications,
excluding the innovations in the field of proteins, solid state, and magnetic
resonance in clinical medicine. To find out more details, see the articles
written by Emsley and Feeney [23], Shoolery [24], and Freeman [25], and their
included references.
20.2.2 Historical Development of LC-NMR
As mentioned at the end of the historical development of NMR section, the
development of the pulse field gradients extended the applications of NMR.
One of the areas not mentioned is the hyphenated techniques. NMR is one of
the most powerful techniques for elucidating the structure of organic com-
pounds. Before undertaking NMR analysis of a complex mixture, separation
of the individual components by chromatography is required. LC-MS is rou-
tinely used to analyze mixtures without prior isolation of its components. In
many cases, however, NMR is needed for an unambiguous identification.Even
though hyphenated LC-NMR has been known since the late 1970s [26–33], it
has not been widely implemented until the last decade [34–40].
The first paper on LC-NMR was published in 1978 [26] using stop-flow to
analyze a mixture of two or three known compounds. At that time, the limi-
tations in the NMR side—for example, sensitivity, available NMR solvents,
software and hardware, and resolution achieved only with sample-spinning—
made direct coupling to the HPLC difficult. Watanabe and Niki [26] modified
the NMR probe to make it more sensitive, introducing a thin-wall teflon tube
of 1.4mm (inner diameter) and thereby transforming it into a flow-through
structure. The effective length and volume of this probe were about 1cm and
15µL, respectively. Two three-way valves connected this probe to the HPLC
detector. This connection needed to be short to minimize broadening of the
chromatographic peaks. During the stop-flow mode, the time to acquire an
NMR spectrum on each peak was limited to two hours to avoid excess broad-
ening of the remaining chromatographic peaks. The authors also mentioned
that use of tetrachloroethylene or carbon tetrachloride as solvents, along with
ETH-silica as a normal-phase column, limited the applications for this tech-
nique. Because solvent suppression techniques were not available at that time,
the authors [26] recognized that more development was required in the soft-
ware and hardware of the NMR side to include the use of reverse-phased
columns and their solvents, which in turn would broaden the range of appli-
cations. A year later, Bayer et al. [27] carried out on-flow and stop-flow exper-
iments with a different flow-probe design on standard compounds. They used
normal phase columns and carbon tetrachloride as solvent. One of their obser-
vations was that the resolution of the NMR spectra in the LC-NMR system
904 LC-NMR OVERVIEW AND PHARMACEUTICAL APPLICATIONS
was poorer than for the uncoupled NMR system, which made the measure-
ment of small coupling constants difficult.
The first application of on-flow LC-
NMR was carried out in 1980 to analyze mixtures of several jet fuel samples
[28]. Deuterated chloroform and Freon-113 and normal-phase columns were
the common conditions used for LC-NMR [29–33], limiting the application of
this technique.
The use of reversed-phase columns in LC-NMR complicates the NMR
analysis because of (1) the use of more than one protonated solvent, which
will very likely interfere with the sample, (2) the change in solvent resonances
during the course of the chromatographic run when using solvent gradients,
and (3) small analyte signals relative to those of the solvent. In 1995 Small-
combe et al. [41] overcame these problems by developing the solvent-
suppression technique, which greatly improved the quality of the spectra
obtained by on-flow or stop-flow experiments. The optimization of the WET
(water suppression enhanced through T1 effects) solvent suppression tech-
nique generates high-quality spectra and effectively obtains 1D on-flow and
stop-flow spectra and 2D spectra for the stop-flow mode, such as WET-
TOCSY, WET-COSY, WET-NOESY, and others [41].
During the last few years, more progress has been achieved by hyphenat-
ing LC-NMR to MS. The LC-NMR-MS or LC-NMR/MS (referred to as LC-
MS-NMR in this chapter) has expanded the structure-solving capabilities by
obtaining simultaneously MS and NMR data from the same chromatographic
peak.There are some compromises that have to be taken into account because
of the differences between MS and NMR, such as sensitivity, solvent compat-
ibility, and destructive versus nondestructive technique, discussed below. LC-
MS has been used for many years as a preferred analytical technique; however,
with the development of electrospray ionization techniques, LC-MS has been
routinely used for the analysis of complex mixtures in the pharmaceutical
industry. LC-MS-NMR is a combination of LC-MS with electrospray and LC-
NMR presented below.
20.3 LC-NMR
20.3.1 Introduction
The decision to use either NMR or LC-NMR for the analysis of mixtures in
the pharmaceutical industry depends on factors related to their chromato-
graphic separation and the ability of NMR to elucidate the structure of organic
compounds whether hyphenated or not.The major technical considerations of
LC-NMR, discussed below, are NMR sensitivity, NMR and chromatographi-
cally compatible solvents, solvent suppression, NMR flow-probe design, and
LC-NMR sensitivity or compatibility of the volume of the chromatographic
peak with the volume of the NMR flow cell for better detection. Figure 20-1
shows the schematic setup of the LC-NMR connected to other devices, such
as radioactivity detector and MS (see Section 20.4).
LC-NMR 905
20.3.1.1 NMR Sensitivity. NMR is a less sensitive technique compared to
MS and hence requires much larger samples for structural analysis
. MS analy-
sis is routinely carried out in the picogram range. Modern high-field NMR
spectrometers (400MHz and higher) can detect proton signals from pure
demonstration samples well into the nanogram range (MW 300Da). With the
cryoprobes (for Bruker NMR instruments) or cold probes (for Varian NMR
instruments), depending on the NMR vendor currently available, the sensi-
tivity of NMR markedly improves. The samples in the low nanogram range
can be detected. In the high nanogram range, structural analysis can be carried
out. For real-world samples, however, purity problems become more intrusive
with diminishing sample size and can be overwhelming in the submicrogram
domain, even by the interference of the impurities from the deuterated solvent
used for the NMR studies. This places a current practical lower limit for most
structural elucidation by NMR, which is estimated by the writer to be close to
500 nanograms (MW 300Da).
Although several other important nuclides can be detected by NMR,
proton (
1
H) remains the most widely used because of its high sensitivity, high
isotopic natural abundance (99.985%), and ubiquitous presence in organic
compounds. Of comparable importance is carbon (
13
C), 1.108% abundance,
which, because of substantial improvements in instrument sensitivity, is now
utilized as routinely as proton. Fluorine (
19
F), 100% abundance, is less used
since it is present in only about 10% of pharmaceutical compounds. Another
consequence of the intrinsic low sensitivity of NMR is that virtually all samples
require signal averaging to reach an acceptable signal-to-noise level. Depend-
906 LC-NMR OVERVIEW AND PHARMACEUTICAL APPLICATIONS
Figure 20-1. Schematic setup for the LC-MS-NMR system. (Reprinted from reference
40, copyright 2003, with permission from Elsevier.)
ing on sample size and amount of sample for the structural analysis, signal
averaging may range anywhere from several minutes to several days
. For
metabolites in the 1- to 10-µg range, for example, overnight experiments are
generally necessary.
20.3.1.2 NMR and Chromatographically Compatible Solvents. Liquid
NMR requires the use of deuterated solvents. Conventionally the sample is
analyzed as a solution using a 5- or 3-mm NMR tube depending on the NMR
probe, which requires ca. 500 or 150µL respectively of deuterated solvents.
The increased solvent requirements for LC-NMR make this technique highly
expensive. Deuterium oxide (D
2
O) is the most readily available, reasonably
priced solvent (over $300/L). The cost of deuterated acetonitrile (CD
3
CN) is
decreasing and varies depending on the percentage of included D
2
O, but is
still over $1000/L. Deuterated methanol (CD
3
OD) is even more expensive.
Deuterated solvents for normal-phase columns are not readily available, but
those that are readily available have even more prohibitive prices. This neces-
sitates the use of reversed-phase columns.Another factor to be concerned with
is compatibility of the HPLC gradient-solvent system with the NMR opera-
tions. An HPLC gradient-solvent system greater than 2–3%/min causes prob-
lems in optimizing the magnetic field homogeneity (shimming) due to solvent
mixing in the flow cell. A gradient-solvent system greater than 3%/min may
take days for the mixture to equilibrate in the flow cell before NMR experi-
ments can be carried out. Recently, with the new technology developments
in solid-phase extraction (SPE) as SPE-NMR and capillary-based HPLC as
capLC-NMR or microflow NMR (see Section 20.3.3), the amount of deuter-
ated solvents needed is much less and is in the microliter to milliter range
to pump the analyte of interest to the flow cell for the NMR analysis. These
developments make the hyphenated NMR techniques economically more
accessible.
20.3.1.3 Solvent Suppression. During the LC-NMR run, the solvent signal
in the chromatographic peak is much larger than those of the sample and
needs to be suppressed.This applies even with deuterated solvents. In the case
of acetonitrile, the two
13
C satellite peaks of either the protonated or residual
protonated methyl group for CH
3
CN or CD
3
CN also require suppression
because they are typically much larger than signals from the sample. With the
optimization of the WET solvent suppression technique by Smallcombe et al.
[41] in 1995, the quality of spectra generated during LC-NMR has been greatly
improved and is routine. The WET solvent suppression technique is the stan-
dard technique for LC-NMR because it has the capability of suppressing
several solvent lines without minimum baseline distortions, compared with
others such as presaturation or watergate. One disadvantage of suppressing
the solvent lines is that any nearby analyte signal will also be suppressed,
resulting in loss of structural information.With the development of SPE-NMR
and capLC-NMR or microflow NMR (see Section 20.3.3), the solvent
LC-NMR 907
suppression is not as dramatic as for conventional LC-NMR improving the
quality of the NMR data.
20.3.1.4
NMR Flow-Probe Design. Conventional NMR flow cells have an
active volume of 60µL (i.e., corresponds to the length of the receiver coil
around the flow cell) and a total volume of 120µL. This means that NMR will
only “see” 60µL of the chromatographic peak. If the flow rate in the HPLC is
1mL/min, when 4.6-mm columns are used,only 3.6sec of the chromatographic
peak will be “seen” by NMR. Chromatographic peaks are generally much
wider than 4sec, indicating that less than half of the chromatographic peak
will be detected. This is one of the disadvantages of LC-NMR compared with
conventional 3-mm NMR probes where the amount of sample “seen” by the
NMR receiver coil is independent of the width of the chromatographic peak.
Recently, NMR flow cells with an active volume of 10, 30, 60, and 120µL are
commercially available. Applications using solid-phase extraction (SPE) as
SPE-NMR will be more appropriate for 10- or 30-µL flow cells (see Section
20.3.3). Microcoil NMR flow cells for capLC-NMR or microflow NMR have
an active volument of 1.5µL for applications of samples in low concentration
(see Section 20.3.3).
20.3.1.5 LC-NMR Sensitivity. Because NMR is a low-sensitivity technique,
which requires samples in the order of several micrograms, analytical HPLC
columns have to be saturated when injecting samples in that range. This will
affect the chromatographic resolution and separation since resolution often
degrades when sample injection is scaled-up to that level. Another factor that
can affect chromatographic performance is the use of deuterated solvents. In
many cases, analytes show broad chromatographic peaks and occasionally dif-
ferent retention times when using deuterated solvents due to different polar-
ity and hydrogen bonding of deuterated versus nondeuterated solvents. When
this occurs, more chromatographic development is required in order to obtain
reasonable resolution. One way to increase the LC-NMR sensitivity is by
decreasing the flow rate to less than 1mL/min. At flow rate lower than
1mL/min, a greater portion of the chromatographic peak will be “seen” by
NMR. However, this is only possible if the pump of the LC system is accurate
at rates lower than 1mL/min. In the case of the SPE-NMR, the LC-NMR sen-
sitivity can be improved by concentrating the chromatographic peak into the
SPE cartridge by injecting the sample several times (see Section 20.3.3). For
capLC-NMR or microflow NMR, the LC-NMR sensitivity can improved if the
sample is concentrated in a volume of 5µL.
20.3.2 Modes of Operation for LC-NMR
The HPLC is connected by red polyether ether ketone (PEEK) tubing to the
NMR flow cell which is inside the magnet.With shielded cryomagnets or ultra-
shielded magnets the HPLC can be as close as 30–50cm to the magnet versus
908 LC-NMR OVERVIEW AND PHARMACEUTICAL APPLICATIONS
1.5–2m for conventional magnets. Normally a UV detector is used in the
HPLC system to monitor the chromatographic run.
Radioactivity or fluores-
cent detectors can also be used to trigger the chromatographic peak(s) of
interest.
There are four general modes of operation for LC-NMR: on-flow, stop-flow,
time-sliced, and loop collection. These modes described below are automated
by software that controls the valves of the HPLC to stop the flow when
needed, depending on the mode of operation selected for LC-NMR.
20.3.2.1 On-Flow. On the on-flow or continuous-flow mode, the chro-
matographic run continues without stopping at any point of the run.The chro-
matographic peaks are flowing through the NMR flow cell while NMR spectra
are being acquired. In this mode, the NMR experiments require more amount
of sample to analyze “on the fly” because the resident time in the NMR flow
cell is very short (3.6sec at 1mL/min) during the chromatographic run, which
limits this approach to 1D NMR spectra acquisition only. This mode can be
used to analyze the major components of the mixture and, in many cases, to
rapidly identify the major known compounds of the mixture.
20.3.2.2 Stop-Flow. On the stop-flow mode, the chromatographic peak is
analyzed under static conditions. The chromatographic peak of interest is sub-
mitted directly from the HPLC to the NMR flow cell. Stop-flow requires the
calibration of the delay time,which is the time required for the sample to travel
from the UV detector of the HPLC to the NMR flow cell, which depends in
turn on the flow rate and the length of the tubing connecting the HPLC with
the NMR. Because the chromatographic run is automatically stopped when
the chromatographic peak of interest is in the flow cell, the amount of sample
required for the analysis can be reduced compared to the on-flow mode and
2D NMR experiments, such as WET-COSY, WET-TOCSY, and others [41],
can be obtained since the sample can remain inside the flow cell for days. It is
possible to obtain NMR data on a number of chromatographic peaks in a
series of stops during the chromatographic run without on-column diffusion
that causes loss of resolution, but only if the NMR data for each chromato-
graphic peak can be acquired in a short time (30min or less if more than four
peaks have to be analyzed, and less than two hours for the analysis of no
more than three peaks). The use of commercially available cryoprobes or
cold probes improves the sensitivity of the stop-flow mode (see Section
20.3.1.1).
For instance, stop-flow is the preferred mode for the analysis of metabo-
lites when the chromatography is reasonable or the metabolite is unstable.
One example is the analysis of the major metabolites of compound I (Figure
20-2), a ras farnesyl transferase inhibitor in rats and dogs [42]. Preliminary
studies by LC-NMR using a linear solvent gradient [5–75% B 0–25min,
75–95% B 25–35min, A: D
2
O, B: ACN (acetonitrile), 1mL/min, 235nm, BDS
Hypersil C18 column 15cm × 4.6cm, 5µm] indicated that even with the use of
LC-NMR 909
protonated acetonitrile in the solvent mixture, all the resonances were visible
(F
igure 20-3). Figures 20-4A and 20-4B are the UV chromatograms from a
small injection of dog bile and dog urine for metabolites M9 (retention time
10min) and M11 (retention time 21min), respectively. These small injections
910 LC-NMR OVERVIEW AND PHARMACEUTICAL APPLICATIONS
Figure 20-2. Structure of compound I, a ras farnesyl transferase inhibitor in rats and
dogs, and proposed structures by MS of its major metabolites in dog bile (M9) and dog
and rat urine (M11). (Reprinted from reference 40, copyright 2003, with permission
from Elsevier.)
Figure 20-3.
1
H NMR spectrum of compound I in stop-flow. (Reprinted from refer-
ence 40, copyright 2003, with permission from Elsevier.)
were carried out to identify the UV chromatographic peaks of the analytes of
interest to determine if there were other chromatographic peaks that could
interfere the NMR studies by stop-flow
. Metabolite M11 was also found in rat
urine. To analyze the structures of M9 and M11 by NMR, larger injections of
dog bile, dog urine, and rat urine were carried out for the stop-flow experi-
ments.The
1
H NMR spectrum on the LC-NMR system (Varian Inova 500 MHz
equipped with an
1
H–
13
C pulse field gradient indirect detection microflow
NMR probe with a 60-µL flow cell, Palo Alto, CA) of M9 (Figure 20-5)
revealed the presence of a 1,2,4-trisubstituted aromatic ring in the 3-
chlorophenyl ring and the glucuronide moiety. Neither of the two possibilities
for the position of the glucuronide moiety ring, positions 4 or 6, could be dis-
tinguished. NOE experiments on the LC-NMR were not successful because
of problems with the solvent suppression. The sample was collected and the
NOE was performed (Varian Unity 400 MHz, equipped with a 3-mm
1
H–
13
C
pulse field gradient indirect detection Nalorac probe, Palo Alto, CA) over a
weekend (Figure 20-6). Even though the collected sample contained more
impurities, the NOE experiment showed that the glucuronide moiety was
attached at C-4 by irradiating the methylene at i which elicited NOE signals
from H-2 and H-6, thus eliminating the C-6 possibility (Figure 20-6). LC-MS
on M11 indicated it to be only the 1-(3-chlorophenyl)piperazinone moiety
with an additional oxidation on the piperazinone ring.The
1
H NMR spectrum
on the LC-NMR system of M11 lacked the isolated methylene signal on the
piperazine ring (Figure 20-7), indicating it to be the (1-(3-chlorophenyl)piper-
azine-2,3-dione).
Recently, a radioactive volatile metabolite M3 with a small molecular
weight was studied using LC-NMR [43]. Conventional NMR was not possible
because the radioactivity of the sample was lost when the fraction containing
the metabolite was evaporated to dryness prior to the NMR studies. In this
LC-NMR 911
Figure 20-4. UV chromatograms from small injections of the dog bile containing
metabolite M9 (A) and dog urine containing metabolite M11 (B). (Reprinted from ref-
erence 40, copyright 2003, with permission from Elsevier.)
912 LC-NMR
OVERVIEW AND PHARMACEUTICAL APPLICATIONS
Figure 20-5.
1
H NMR spectrum of metabolite M9 from dog bile in stop-flow mode.
(Reprinted from reference 40, copyright 2003, with permission from Elsevier.)
Figure 20-6.
1
H NMR (bottom) and 1D NOE spectra at i (top) of M9 from dog bile
recovered from LC-NMR.
(Reprinted from reference 40, copyright 2003, with permis-
sion from Elsevier.)
example, the LC-MS was not informative, suggesting a molecular weight less
than 200
Da. LC-NMR was one of the alternatives used to solve this structural
problem. To be able to identify the UV chromatographic peak corresponding
to the radioactive metabolite, a radioactivity detector equipped with a liquid
cell (Radiomatic C150TR, Packard) was connected on-line to the LC-UV
system of the LC-NMR. Figure 20-1 shows the schematic diagram for this
setup. Small injections were carried out initially to identify the metabolite UV
chromatographic peak with the radioactive peak prior to the stop-flow exper-
iments (Figure 20-8). Stop-flow experiments were triggered by UV because
the transfer delay from the UV to the NMR was shorter than from the radioac-
tive detector to the NMR, due to the thicker tubing used in the liquid cell of
the radioactivity detector.
1
H NMR spectrum revealed the presence of the p-
fluorophenyl ring with the characteristic splitting pattern, indicating that
the compound was drug-related. The downfield shift of the ortho protons at
7.91ppm suggested the presence of a carbonyl substituent (Figure 20-8). The
presence of a singlet at 4.85ppm, integrating for approximately two protons,
was consistent with a methylene that was flanked by the carbonyl and a
hydroxyl group (Figure 20-8). These features thus led to proposing the struc-
ture for M3 as the p-fluoro-α-hydroxyacetophenone (Figure 20-8).
20.3.2.3 Time-Sliced Mode. The time-sliced mode involves a series of stops
during the elution of the chromatographic peak of interest.A time-sliced mode
is used when two analytes elute together or with close retention times, or when
the separation is poor. Depending on the NMR vendor, the software can be
LC-NMR 913
Figure 20-7.
1
H NMR spectrum of metabolite M11 from dog urine in stop-flow mode.
(Reprinted from reference 40, copyright 2003, with permission from Elsevier.)
designed to automate this mode, but sometimes the analyst may prefer to do
it manually
.
20.3.2.4 Loop Collection. On the loop collection mode, the chromato-
graphic peaks of interest are automatically stored in loops controlled by the
software for later off-line NMR study.Then the stored chromatographic peaks
are transferred to the NMR flow cell individually for NMR studies. The soft-
ware is designed to send the stored chromatographic peaks to the NMR flow
cell in the same or different order as they were stored from the chromato-
graphic run. Loop collection can be used when there is more than one chro-
matographic peak of interest in the same run. In this case the analytes must
be stable inside the loops during the extended period of analysis. Capillary
tubing should be used to avoid peak broadening with concomitant loss of
analyte “seen” by the NMR spectrometer. Loop collection can be used in con-
nection with SPE for SPE-NMR analysis (see Section 20.3.3).
20.3.3 Other Analytical Separation Techniques Hyphenated with NMR
Recently, other chromatographic techniques have been coupled on-line to
NMR for additional applications in the pharmaceutical environment, such as
914 LC-NMR OVERVIEW AND PHARMACEUTICAL APPLICATIONS
Figure 20-8. UV-radioactive (C-14) chromatograms of the fraction containing metabo-
lite M3 (top) and expanded sections of the
1
H NMR spectrum of metabolite M3
acquired for one day (bottom).
size-exclusion chromatography (SEC) as SEC-NMR for the characterization
of polymer additives [44],
capillary electrophoresis (CE) as CE-NMR for small
volume samples [45–47], capillary electrochromatography (CEC) as CEC-
NMR, capillary zone electrophoresis (CZE) as CZE-NMR for on-flow iden-
tification of metabolites with small volume samples [46, 48–52], and
gel-permeation chromatography (GPC) as GPC-NMR and supercritical fluid
chromatography (SFC) as SCF-NMR for polymer separation and identifica-
tion [53] as examples. CE-NMR and CEC-NMR are techniques that work with
very small-volume NMR probes with capillary separations. Solid-phase extrac-
tion (SPE) as SPE-NMR is becoming a popular technique for trace analysis.
In SPE-NMR, the chromatographic peaks are trapped into trap cartridges
using multiple injections to increase the concentration of the chromatographic
peaks, and then the cartridges are dried with nitrogen to remove all residual
solvents. With this technique, deuterated solvents are only used to flush each
peak from the cartridge to the NMR flow cell, creating a sharp eluting band
(25- to 30-µL eluting volume) that requires the use of small NMR flow cells,
such as 10- or 30-µL flow cells. SPE-NMR allows increasing the sensitivity
compared with regular LC-NMR.The recent use of cryogenic flow probe with
the SPE-NMR application improves tremendously the sensitivity of NMR
[54]. SPE-NMR has been applied for trace analysis [55], microbial metabolites
[56], and natural products [54, 57, 58]. Lately, more developments have been
carried out to hyphenate capillary-based HPLC (capLC) with NMR as capLC-
NMR or microflow NMR and the use of commercial microcoil NMR probes
[46, 59–61]. With microcoil NMR probes, the range of sample used in capLC-
NMR could reach the nanogram level (low nanogram level only for detection
limit but not for structural analysis) [46, 59–61]. With this technique, the
volume of the chromatographic peak is comparable to the volume of the
microcoil NMR flow cell. The volume observed for a commercial microcoil
NMR flow cell is approximately 1.5µL, and there is a wider range of solvent
gradient variation than in the standard LC-NMR. CapLC-NMR can be used
without a column for analysis of low concentrated pure compounds, such as
1µg, or with the column to study mixtures of compounds. One of the require-
ments for capLC-NMR is that the sample has to be soluble in a volume of
approximately 5µL or less, which is not always possible. The delay time
between the UV detector of the cap-LC and the NMR flow cell has to be cal-
ibrated for all chromatographic conditions due to the changes of viscosity of
the different solvent compositions, which has an effect on the pump of the
cap-LC. More recently, the development of multiple coils connected in paral-
lel may be applicable to acquire NMR data of several samples at the same
time [39, 62–64]. So far, four samples can be run at the same time, but recent
developments are going toward analysis of 96-well plates emulating tech-
niques such as LC-MS [39]. CapLC-NMR with single or multiple solenoidal
microcoils can also be used with other capillary techniques such as capillary
electrophoresis (CE) [63, 64], capillary isotachophoresis [63, 65, 66], and
others [63].
LC-NMR 915
20.3.4 Applications of LC-NMR
T
here are many examples in the literature for applications of LC-NMR in the
pharmaceutical industry. In the area of natural products, LC-NMR has been
applied to screen plant constituents from crude extracts [54, 57, 67, 68] and to
analyze plant and marine alkaloids [69–72], flavonoids [73], sesquiterpene lac-
tones [74, 75],saponins [58, 76], vitamin E homologues [77], and antifungal and
bacterial constituents [56, 78, 79] as examples. In the field of drug metabolism,
LC-NMR has been extensively applied for the identification of metabolites
[42, 80–88] and even polar [89] or unstable metabolites [43]. And finally, LC-
NMR has been used for areas such degradation products [90–93], drug impu-
rities [94–102], drug discovery [103, 104], and food analysis [105–107].
20.4 LC-MS-NMR (OR LC-NMR-MS OR LC-NMR/MS)
20.4.1 Introduction
The capability of analyzing a complex mixture in a chromatographic run by
the hyphenation of several techniques, such as NMR and MS, to HPLC is
becoming more popular in the pharmaceutical industry. NMR and MS data
on the same analyte are crucial for structural elucidation. When different iso-
lates such as metabolites are analyzed by NMR and MS, one cannot always
be certain that the NMR and the MS data apply to the same analyte, espe-
cially when the analytes have been isolated using analytical columns and prep
columns for the MS and NMR analysis, respectively. HPLC conditions are not
always reproducible when analytical and prep-HPLC columns are used to
isolate different amounts of the analytes of interest. To avoid this ambiguity,
LC-MS and LC-NMR are combined. MS data should be obtained initially
because with NMR, data collection in the stop-flow mode can take hours or
days, depending on the complexity of the structure and the amount of sample.
This is why it is preferable to designate this operation as LC-MS-NMR rather
than LC-NMR-MS or LC-NMR/MS.
Since MS is considerably more sensitive than NMR, a splitter is incorpo-
rated after the HPLC to direct the sample to the MS and NMR units sepa-
rately. In the example below, the MS used in these studies is a classic LCQ
instrument (ThermoFinnigan, CA). A custom-made splitter was used with
a splitting ratio of 1/100 (Acurate
TM
, LC Packings, CA). It was designed to
deliver 1% of the sample initially to the MS and the balance 20 seconds later
to the NMR. With a flow rate of 1mL/min, the final flow rate going to the
NMR will be 0.990mL/min, and the final flow rate going to the MS will be
0.010mL/min. Electrospray is the only source of ionization that will work with
such low flow rate (10µL/min) in LCQ. Figure 20-1 depicts the scheme of the
LC-MS-NMR system used in the example for this chapter. The technical con-
siderations of LC-MS-NMR are the same as LC-NMR (see Section 20.3) plus
the effect of using deuterated solvents for the MS of the LC-MS-NMR.
916 LC-NMR OVERVIEW AND PHARMACEUTICAL APPLICATIONS
For the last 4–5 years, the LC-NMR-MS system has been commercially
available only for the Bruker NMR instruments
. For the Varian NMR instru-
ments, the system has recently become available.The work presented here has
been carried out by the author using a custom design of the LC-MS-NMR
system on a Varian NMR instrument as explained above.
20.4.1.1 The Use of Deuterated Solvents. Another consideration for the
LC-MS-NMR is the use of deuterated solvents needed for NMR. Analytes
with exchangeable or “active” hydrogens can exchange (i.e., equilibrate) with
deuterium (
2
H) at different rates. The analyst should be alert to this possibil-
ity because it could result in the appearance of several closely spaced molec-
ular ions with pseudo-molecular ions increased, depending on the number
of exchangeable hydrogens being deuterated. If the compound of interest
exchanges all the active hydrogens for deuteriums, the pseudo-molecular mol-
ecular ion will be [M +
2
H]
+
or [M −
2
H]
−
in positive or negative mode, respec-
tively, where M is the molecular weight with all the exchangeable hydrogens
deuterated. When buffers or other compatible solvents for MS are needed, it
is recommendable to use deuterated buffers to avoid the suppression of addi-
tional solvent lines in the NMR spectra (see Section 20.3.1.3).
20.4.2 Modes of Operation for LC-MS-NMR
As mentioned in the section of modes of operation for LC-NMR (Section
20.3.2), with the use of shielded cryomagnets, the location of the MS instru-
ment will follow the same rule as for the HPLC. The most common modes of
operation for LC-MS-NMR are on-flow and stop-flow.With stop-flow, the MS
instrument can also be used to stop the flow on the chromatographic peak of
interest that is to be analyzed by NMR. These two modes are presented here
with an example. In the loop collection mode, the MS of the LC-MS-NMR
system may also monitor the trapping of the chromatographic peak inside
the loop.
In the last few years, there have been relatively few examples in the litera-
ture dealing with the application of LC-MS-NMR in the pharmaceutical indus-
try.The author of this chapter has been interested in evaluating this technology
to determine the pros and cons and to decide which cases are suitable for this
application. To illustrate these modes of operation, a group of flavonoids was
chosen. Eight flavonoids were selected to mimic a real complex mixture of
compounds of similar structure that may present some ambiguity in their
analysis that can be resolved by this hyphenated technique versus the indi-
vidual nonhyphenated techniques. Figure 20-9 shows the eight flavonoids
(Aldrich) chosen for this example. These compounds have simple structures
composed primarily of aromatic protons; some have low-field aliphatic
protons which would not be hidden under the NMR solvent peaks. Phenolic
protons exchange rapidly with D
2
O, so that each compound will only show
one pseudo-molecular ion. Flavonoids are natural products with important
LC-MS-NMR (OR LC-NMR-MS OR LC-NMR/MS) 917
biological functions acting as antioxidants, free radical scavengers, and metal
chelators and are important to the food industry
.
The chromatographic conditions are as follows: 35–50% B 0–10min,
50–80% B 10–15min; A, D
2
O; B, ACN; 1mL/min, 287nm, Discovery C18
column 15cm × 4.6cm, 5µm.Stock solutions of each compound were prepared
at 1µg/µL in ACN:MeOH 1:1.
A Varian Unity Inova 600-MHz NMR instrument (Palo Alto, CA) equipped
with a
1
H{
13
C/
15
N} pulse field gradient triple resonance microflow NMR probe
(flow cell 60µL; 3mm O.D.) was used. Reversed-phase HPLC of the samples
was carried out on a Varian modular HPLC system (a 9012 pump and a 9065
photodiode array UV detector).The Varian HPLC software was also equipped
with the capability for programmable stop-flow experiments based on UV
peak detection. An LCQ classic MS instrument, mentioned in the previous
section, was connected on-line to the HPLC-UV system of the LC-NMR by
contact closure. The
2
H resonance of the D
2
O was used for field-frequency
lock, and the spectra were centered on the ACN methyl resonance. Suppres-
sion of resonances from HOD and methyl of ACN and its two
13
C satellites
was accomplished using a train of four selective WET pulses, each followed
by a B
o
gradient pulse and a composite 90-degree read pulse [41].
20.4.2.1 On-Flow. The on-flow experiment was carried out on a mixture of
eight flavonoids (Figure 20-9) (20µg each). MS and NMR data were obtained
during this on-flow experiment. The UV chromatogram is depicted in Figure
20-10.Table 20-1 and Figures 20-12A–D show the pseudo-molecular ion infor-
mation [M −
2
H]
−
, where M is the molecular weight with all the hydroxyl
918 LC-NMR OVERVIEW AND PHARMACEUTICAL APPLICATIONS
Figure 20-9. Structures of eight flavonoids used for the LC-MS-NMR technology
development studies. (Reprinted from reference 40, copyright 2003, with permission
from Elsevier.)
protons deuterated, in negative mode for the eight flavonoids obtained in this
on-flow experiment.
Figure 20-11 is the 2D data set (time versus chemical
shift) where each
1
H NMR spectrum was acquired for 16 scans and decreas-
ing the delays (total time per spectrum of 20sec) to obtain more spectra during
LC-MS-NMR (OR LC-NMR-MS OR LC-NMR/MS) 919
Figure 20-10. UV chromatogram of the on-flow experiment injecting a mixture of eight
flavonoids (A: catechin + epicatechin; B: fisetin; C: quercetin; D: apigenin; E: narin-
genin; F: baicalein; G: galangin). (Reprinted from reference 40, copyright 2003, with
permission from Elsevier.)
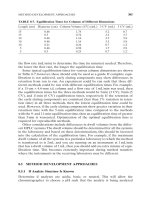
TABLE 20-1. MS Data of Flavonoids in Negative Mode from the On-Flow Run in
the LC-MS-NMR
Peak Compound MW
a
M
b
m/z, [M-
2
H]
−
A Catechin + Epicatechin 290 295 293
B Fisetin 286 290 288
C Quercetin 302 307 305
D Apigenin 270 273 271
E Naringenin 272 275 273
F Baicalein 270 273 271
G Galangin 270 273 271
a
Molecular weight.
b
Molecular weight with all the hydroxyl protons deuterated.
Source: Reprinted from reference 40, copyright 2003, with permission from Elsevier.
the chromatographic run and have more data points for the
1
H NMR spectra
of the different components of the chromatographic run.
Figures 20-12A–D
depict the
1
H NMR traces of each flavonoid extracted from the 2D data set.
Notice that catechin and epicatechin co-elute under these conditions (peak A
of the UV chromatogram of Figure 20-10). Distinguishing these diastereomers
by MS alone is not feasible (Table 20-1 and Figure 20-12A) because both have
the same pseudo-molecular ion information. Differences in the NMR spectra
would be expected and are, in fact, observed (Figure 20-12A). The ability of
LC-MS-NMR to distinguish signals from the individual diastereomers is illus-
trated in Figures 20-11 and 20-12A. The protons H-2 and H-3 in catechin and
H-2a and H-3a in epichatechin show different chemical shifts because of the
slightly different local chemical environment around the chiral centers C-2 and
C-3 for catechin and C-2a and C-3a for epicatechin as diasteromers.Those dif-
ferences are enough for NMR to be able to distinguish well the diasteromers
of organic molecules. The
1
H NMR spectrum of naringenin in Figure 20-12C
shows the ability of NMR to analyze a mixture of two components in differ-
ent ratio (X indicates the signals coming from apigenin as the minor compo-
nent of this chromatographic peak). In this particular case, NMR shows clearly
the presence of the two components of the mixture and MS only shows the
major component. Assignments can be easily carried out based on the differ-
ent ratios of the NMR signals for both compounds. This is another advantage
of NMR versus MS.
920 LC-NMR OVERVIEW AND PHARMACEUTICAL APPLICATIONS
Figure 20-11. 2D data set (time/min versus chemical shift/ppm) for the on-flow exper-
iment injecting a mixture of eight flavonoids (A: catechin + epichatechin; B: fisetin; C:
quercetin; D: apigenin; E: naringenin; F: baicalein; G: galangin). (Reprinted from ref-
erence 40, copyright 2003, with permission from Elsevier.)
LC-MS-NMR (OR LC-NMR-MS OR LC-NMR/MS) 921
Figure 20-12A. MS and
1
H NMR spectra from the 2D data set of the on-flow experiment of catechin and epicatechin.
(Reprinted from reference 40,
copyright 2003, with permission from Elsevier.)
922 LC-NMR OVERVIEW AND PHARMACEUTICAL APPLICATIONS
Figure 20-12B. MS and
1
H NMR spectra from the 2D data set of the on-flow experiment of fisetin (bottom) and quercetin
(top). (Reprinted from reference 40, copyright 2003, with permission from Elsevier.)
LC-MS-NMR (OR LC-NMR-MS OR LC-NMR/MS) 923
Figure 20-12C. MS and
1
H NMR spectra from the 2D data set of the on-flow experiment of apigenin (bottom)
and naringenin (top). (Reprinted from reference 40, copyright 2003, with permission from Elsevier.)
924 LC-NMR OVERVIEW AND PHARMACEUTICAL APPLICATIONS
Figure 20-12D. MS and
1
H NMR spectra from the 2D data set of the on-flow experiment of baicalein (bottom) and
galangin (top). (Reprinted from reference 40, copyright 2003, with permission from Elsevier.)
20.4.2.2 Stop-Flow. T
wo stop-flow experiments were carried out on api-
genin (10µg) (Figure 20-9) using, independently, the UV peak maximum or
the pseudo-molecular ion chromatographic peak seen in the total ion chro-
matogram (TIC) for the MS instrument to trigger the stop-flow. Since the
Varian software automatically triggers the stop-flow with the UV peak, this
mode was used as a reference point. When the MS was used to trigger the
stop-flow, it was carried out manually with a chronometer while monitoring
the molecular ion of apigenin in negative mode (m/z 275). After peak detec-
tion in the UV or MS and a time delay of about 52sec or 20sec, respectively,
the HPLC pump was stopped, trapping the peak of interest in the LC-NMR
microprobe.
1
H NMR stop-flow spectra were acquired using an acquisition
time of 1.5sec, a delay between the successive pulses of 0.5sec, a spectral width
of 9000Hz, and 32K time-domain data points. The methyl resonance of ACN
was referenced to 1.94ppm.These two experiments were carried out injecting
10µg of apigenin and acquiring
1
H NMR spectra for ∼4.5min (128 scans),
giving rise to the same quality of
1
H NMR spectra of apigenin (Figure
20-13).
These experiments indicated that for sample mixtures, the on-flow mode of
LC-MS-NMR is useful for obtaining structural information on the major com-
ponents. If more detailed analysis is required, or the amount of sample is small
and the compound(s) cannot be isolated because of instability or volatility,
stop-flow is the mode of choice. LC-MS and LC-NMR chromatographic
LC-MS-NMR (OR LC-NMR-MS OR LC-NMR/MS) 925
Figure 20-13.
1
H NMR spectra of apigenin triggering the stop-flow by UV (bottom)
and by MS (top).
(Reprinted from reference 40, copyright 2003, with permission from
Elsevier.)