Tài liệu Chapter 3_Project management professional pptx
Bạn đang xem bản rút gọn của tài liệu. Xem và tải ngay bản đầy đủ của tài liệu tại đây (184.32 KB, 28 trang )
CHAPTER 3
Cost Management
C
ost management is the completion of the project management triple
constraint of cost, schedule, and scope. Each of these must be com-
pleted in order to complete the project on time and on budget and
to meet all of the customer’s expectations. In order to meet the cost goals of
the project, the project must be completed within the approved budget.
Why We Need Cost Management
The project manager is primarily concerned with the direct cost of the proj-
ect, but the trend in project management is that the role of the project
manager in cost control will increase to include more of the nontraditional
areas of cost control. In the future it will be expected that more project
managers will have a great deal of input into the indirect costs and expenses
of the project.
Regardless of what the project manager is or is not responsible for, it is
critical that the project be measured against what the project manager is
responsible for and nothing else. If the project manager does not have re-
sponsibility for the material cost of the project, then it makes no sense for
the project manager to be measured against this metric.
Timing of the collection of cost information is also important to the
cost measurement system. The project budgets must be synchronized with
the collection of the project’s actual cost. For example, if a project team is
responsible for material cost, should the budget show the expenditure when
77
78 Preparing for the Project Management Professional Certification Exam
the commitment by the project team to buy the product is made, when the
item is delivered, when it is accepted, or when it is paid for? Timing issues
like these can make project cost control a nightmare.
If the project team does not properly control cost, the project will
invariably go out of control, and more money will be spent than anticipated.
It is the purpose of cost management to prevent this.
Project Life Cycle and Project Cost
Lately, it has become important to consider the cost of the project for the
full useful life of the product or service that is created. This means that the
cost of the project does not end when final acceptance of the project has
been completed. Guarantees, warranties, and ongoing services that must be
performed during the life of the project must be considered.
With regard to project life cycle, cost decisions are made with a clearer
picture of the future commitments that the project will require. If life cycle
cost is considered, better decisions will be made. An example of this would
be the project of creating a software program for a customer. The project
team can create a working software program without organization or docu-
mentation. This is usually called ‘‘spaghetti code.’’ Considering the cost of
the project as delivered, the ‘‘spaghetti coded’’ project will be less costly.
Considering the life cycle cost of the project, however, this approach will be
more costly. This is because the cost of debugging and modifying the soft-
ware after delivery of the project will be more difficult.
Using the Work Breakdown Structure
The work breakdown structure is the key to successful projects. The work
breakdown structure produced a list of the individual pieces of work that
must be done to complete a project. These are the building blocks of the
project. Each of these represents a portion of the work of the project. Each
must be the responsibility of one and only one person on the project team.
The person responsible for an individual piece of work is similar to the
project manager and is responsible for all that happens in the project regard-
ing that piece of work. That person is responsible for scheduling, cost esti-
mating, time estimating, and of course seeing that the work gets done. Like
the project manager, the person responsible may not be required to do all
the work. He or she is, however, responsible for seeing that it gets done.
9618$$ $CH3 09-06-02 14:58:58 PS
79Cost Management
You perhaps have noticed that I have been using the phrase ‘‘individual
piece of work’’ to describe the bottom level of the WBS. This is because the
Professional Management Institute (PMI) makes a distinction between
terms. These individual pieces of work can be referred to as work packages,
activities, or tasks. Most project managers would not make a distinction
between these three terms, and if they did, they would probably disagree
about the meanings of the terms. Most project managers will use the words
activity and task interchangeably.
According to the Guide to the PMBOK definition of these terms, a work
package is the lowest level of the WBS. This means that it is the lowest level
that the project manager intends to manage. In a very large project with a
hierarchical structure of project managers and subproject managers, there
will be managers for the work packages, and each manager will have his or
her own work breakdown structure. Eventually a point is reached where
cost, resources, and duration define the individual pieces of work. These,
according to the Guide to the PMBOK, are called activities. Activities may be
further subdivided into tasks. Learning all this may get you a point on the
PMP exam, but in this book I will use the words activity and task inter-
changeably.
In order to determine the project cost accurately enough to be consid-
ered the project cost baseline, a bottom up estimate must be made. This
estimate must have an accuracy of מ5 percent to ם10 percent. This type
of estimate will be produced by estimating the cost of each item at the
bottom level of the WBS and then summarizing or rolling up the data to
the project level.
Bottom up estimates are inherently more accurate because they are a
sum of individual elements. Each of the individual elements has a possibility
of being over or under the actual cost that will occur. When they are added
together, some of the overestimates will cancel out some of the underesti-
mates.
Cost Estimating
A cost estimate is a prediction of the likely cost of the resources that will be
required to complete all of the work of the project.
Cost estimating is done throughout the project. In the beginning of the
project proof of concept estimates must be done to allow the project to go
on. An ‘‘order of magnitude’’ estimate is performed at this stage of the proj-
9618$$ $CH3 09-06-02 14:58:59 PS
80 Preparing for the Project Management Professional Certification Exam
ect. Order of magnitude estimates can have an accuracy of מ25 percent to
ם75 percent. As the project progresses, more accurate estimates are re-
quired. Budget estimates are those that have an accuracy of מ10 percent to
ם25 percent. Finally, at the time of creating the project cost baseline, the
definitive estimate of מ5 percent to ם10 percent is done. Early in the
project there is much uncertainty about what work is actually to be done in
the project. There is no point in expending the effort to make a more accu-
rate estimate than the accuracy needed at the particular stage that the project
is in.
Types of Estimates
Several types of estimates are in common use. Depending on the accuracy
required for the estimate and the cost and effort that can be expended, there
are several choices.
Top Down Estimates
Top down estimates are used to estimate cost early in the project when
information about the project is very limited. ‘‘Top down’’ comes from the
idea that the estimate is made at the top level of the project. That is, the
project itself is estimated with one single estimate. The advantage of this
type of estimate is that it requires little effort and time to produce. The
disadvantage is that the accuracy of the estimate is not as good as it would
be with a more detailed effort.
Bottom Up Estimates
Bottom up estimates are used when the project baselines are required
or a definitive type of estimate is needed. These types of estimates are called
‘‘bottom up’’ because they begin by estimating the details of the project and
then summarizing the details into summary levels. The WBS can be used
for this ‘‘roll up.’’ The advantage of this kind of estimate is that it will
produce accurate results. The accuracy of the bottom up estimate depends
on the level of detail that is considered. Statistically, convergence takes place
as more and more detail is added. The disadvantage of this type of estimate
is that the cost of doing detailed estimating is higher, and the time to pro-
duce the estimate is considerably longer.
Analogous Estimates
Analogous estimates are a form of top down estimate. This process uses
the actual cost of previously completed projects to predict the cost of the
9618$$ $CH3 09-06-02 14:59:00 PS
81Cost Management
project that is being estimated. Thus, there is an analogy between one project
and another. If the project being used in the analogy and the project being
estimated are very similar, the estimates could be quite accurate. If the proj-
ects are not very similar, then the estimates might not be very accurate at all.
For example, a new software development project is to be done. The
modules to be designed are very similar to modules that were used on an-
other project, but they require more lines of code. The difficulty of the
project is quite similar to the previous project. If the new project is 30
percent larger than the previous project, the analogy might predict a project
cost of 30 percent greater than that of the previous project.
Parametric Estimates
Parametric estimates are similar to analogous estimates in that they are
also top down estimates. Their inherent accuracy is no better or worse than
analogous estimates.
The process of parametric estimating is accomplished by finding a pa-
rameter of the project being estimated that changes proportionately with
project cost. Mathematically, a model is built based on one or more parame-
ters. When the values of the parameters are entered into the model, the cost
of the project results.
If there is a close relationship between the parameters and cost and the
parameters are easy to quantify, the accuracy can be improved. If there are
historical projects that are both more costly and less costly than the project
being estimated and the parametric relationship is true for both of those
historical projects, the estimating accuracy and the reliability of the parame-
ter for this project will be better.
Multiple parameter estimates can be produced as well. In multiple pa-
rameter estimates various weights are given to each parameter to allow for
the calculation of cost by several parameters simultaneously.
For example, houses cost $115 per square foot. Software development
cost is $2 per line of code produced. An office building costs $254 per square
foot plus $54 per cubic foot plus $2,000 per acre of land, and so on.
Definitive Estimates
Definitive estimates are of the bottom up variety. This is the type of
estimate that is used to establish a project baseline or any other important
estimate. In a project, the WBS can be used as the level of detail for the
estimate. The accuracy of this estimate can be made to be quite high, but
9618$$ $CH3 09-06-02 14:59:00 PS
82 Preparing for the Project Management Professional Certification Exam
the cost of developing the estimate can be quite high and the time to produce
it can be lengthy as well.
Definitive estimates are based on the statistical central limit theorem,
which explains statistical convergence. If we have a group of details that can
be summarized, the variance of the sum of the details will be less significant
than the significance of the variance of the details themselves. All this means
is that the more details we have in an estimate, the more accurate the sum
of the details will be. This is because some of the estimates of the details will
be overestimated, and some will be underestimated. The overestimates and
underestimates will cancel each other out. If we have enough detail, the
average overestimates and underestimates will approach a zero difference.
If we flip a coin one time, we can say it comes up 100 percent heads or
100 percent tails. If we continue flipping the coin a large number of times,
and the coin is a fair coin, then 50 percent of the flips will be heads and 50
percent of the flips will be tails. It may be that there are more heads than
tails at one time or another, but if we flip the coin long enough, there will
be 50 percent heads and 50 percent tails at the end of the coin flipping.
If we know the mean or expected values and the standard deviations
for a group of detailed estimates, we can calculate the expected value and the
standard deviation of the sum. If we are also willing to accept that the proba-
bility of the estimate being correct follows a normal probability distribution,
then we can predict the range of values and the probability of the actual
cost.
Using the same estimates for the expected value and the standard devia-
tion that we used in the PERT method for schedules, we can make these
calculations. These are only approximations of these values, but they are
close enough to be used in our estimating work.
Expected Value ס [Optimistic ם Pessimistic ם (4 ן Most Likely)] / 6
Standard Deviation ס (Pessimistic מ Optimistic) / 6
Where do these values come from? Most estimators report a single value
when they complete a cost estimate. However, they think about what the
cost will be if things go badly, and they think about what the cost will be if
things go well. These thoughts are really the optimistic and pessimistic values
that we need for our calculations. They do not cost us a thing to get. All we
have to do is to get the estimator to report them to us.
For definitive estimates we are usually happy to get a 5 percent proba-
bility of being correct. As luck would have it, this happens to be the range
9618$$ $CH3 09-06-02 14:59:01 PS
TEAMFLY
Team-Fly
®
83Cost Management
of values that is plus or minus 2 standard deviations from the mean or
expected value.
For example, suppose we want to estimate the cost of a printed circuit
board for a electrical device of some sort. In table 3-1, the optimistic, pessi-
mistic, and most likely values that were estimated are entered in columns 2,
3, and 4. From these estimated values the expected value of the individual
components can be calculated. This is shown in column 5. The expected
value of the assembly can be reached by adding the expected values.
The standard deviation for each component is calculated and shown in
column 6. In order to add the standard deviations they must first be squared.
These values are shown in column 7. Next, the square of each of the standard
deviations for each component is added, and the square root is taken of the
total. This is the standard deviation of the assembly.
The expected value of the assembly is $5.54, and the standard deviation
is 7.3 cents. We are interested in the range of values that have a probability
of containing the actual cost of the assembly when it is produced. The range
of values that would have a 95 percent probability of occurring is plus or
minus 2 standard deviations from the expected value. In our example we can
say that the assembly has a 95 percent probability of costing between $5.39
and $5.67.
Cost Budgeting
Cost budgeting is the process of allocating cost to the individual work items
in the project. Project performance will be determined based on the budget
allocated to the various parts of the project. The result of the cost budgeting
process will be to produce the cost baseline of the project.
The cost baseline for the project is the expected actual cost of the proj-
ect. The budget for a project should contain the estimated cost of doing all
of the work that is planned to be done for the project to be completed. In
addition, cost must be budgeted for work that will be done to avoid, transfer,
and mitigate risks. Contingency must be budgeted for risks that are identi-
fied and may or may not come to pass. A reserve must be budgeted for risks
that are not identified.
On most projects, the expected value for risks is budgeted. This is
reasonable since it reflects the average risk exposure for the project. Using
the worst case or the best case situation for the project would be overly
pessimistic or optimistic.
9618$$ $CH3 09-06-02 14:59:01 PS
Table 3-1. Estimate of the cost of a printed circuit board.
Most Expected Standard
Item Description Optimistic Pessimistic Likely Value Deviation SD Squared
1 100 ohm resistor 0.04 0.06 0.05 0.050
0.0033 0.00001111
2 200 ohm resistor 0.06 0.09 0.07 0.072 0.0050 0.00002500
3 10 ohm resistor 0.03 0.04 0.03 0.032
0.0017 0.00000278
4 10 mf capacitor 0.22 0.25 0.22 0.225
0.0050 0.00002500
5 20 mf capacitor 0.28 0.36 0.33 0.327
0.0133 0.00017778
6 5 mf capacitor 0.11 0.13 0.12 0.120 0.0033 0.00001111
7 Integrated circuit 1.66 1.88 1.79 1.783
0.0367 0.00134444
8 Wire 0.33 0.33 0.33 0.330 0.0000 0.00000000
9 Circuit board 1.7 2.05 1.98 1.945 0.0583 0.00340278
10 Connector 0.57 0.7 0.67 0.658 0.0217 0.00046944
Sum of Squares 0.00546944
Total Cost 5.542 Standard Deviation 0.07395569
9618$$ $CH3 09-06-02 14:59:02 PS
84 Preparing for the Project Management Professional Certification Exam
85Cost Management
Cost Control
Cost control is the process of controlling the project cost and taking correc-
tive action when the control indicates that corrective action is necessary.
Earned Value Reporting
The earned value reporting system is now the most commonly used method
of performance measurement and project control. The reason for the popu-
larity of this reporting system in project management is that it reports per-
formance to cost and performance to schedule in one report. Schedule and
cost are both measured in dollars. Where earned value reporting is not used,
reports favor measuring performance to schedule or performance to budget.
In any reporting system the principle is to set some standard and then
measure the actual performance to that standard, and report on the observed
differences. In the earned value reporting system we use the planned budget
and schedule and then measure the actual progress in the budget and
schedule.
Frequently, the Gantt chart is used to show progress and performance
to schedule, but this does not state the case clearly. If a scheduled activity is
shown to be three days behind schedule, it is important to know if there is
one person involved in this activity or if there are twenty.
In reporting cost, actual cost is frequently compared to budget cost to
date. This does not show the full picture either. If a project is behind sched-
ule, the actual cost could be tracking nicely to the expected budgeted expen-
ditures, and the project could still be in a great deal of trouble.
Using the earned value reporting system the progress of the project in
terms of cost is measured in dollars. The progress of the project in terms of
schedule is also measured in dollars. This may sound confusing to people
who are used to thinking of schedules in terms of days ahead or days behind.
In fact, it is a more informational description of the condition of the project
schedule. If a project activity is reported as being five days behind schedule,
and there is one person working on the activity part time, it is very different
than an activity that is behind five days that has twenty people working on it.
Obviously, what is needed is a reporting system that combines perform-
ance, schedule, and budget. This is the purpose of the earned value reporting
system.
Cumulative Reporting
Earned value reports are cumulative reports. The values collected for
the current reporting period are added to the values from the last reporting
period, and the total is plotted.
9618$$ $CH3 09-06-02 14:59:02 PS
86 Preparing for the Project Management Professional Certification Exam
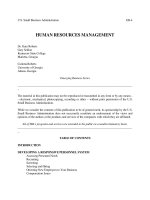
Cumulative values will never go down unless a value is reversed. It can
be seen, in figure 3-1 that cumulative cost curves have a characteristic ‘‘S’’
shape. This is because projects typically start out spending money slowly and
gradually increase their spending rate until a peak is reached, and then they
gradually decrease their rate of spending until the project is finally com-
pleted.
One difficulty in showing the cumulative cost curve for a large project
is that the scale required to show the entire cost of the project may be so
compact that relatively large variations are not visible. A $400 million project
plotted on an 8
1
/2-by-11-inch page would have a million dollar variation
shown by only one-fiftieth of an inch.
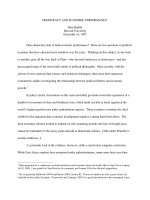
Where large numbers are used, a plot of the variance can be used. The
scale of this type of chart can be much less compact and still show the needed
information. It is made by simply drawing a line as a zero base and then
plotting the difference between actual and expected values (figure 3-2).
Earned Value Parameters
The earned value reporting system depends on the tracking of three
measurements of the project.
1. Budgeted cost of work scheduled (BCWS), or planned value (PV).
PMI has changed the traditional designations in the earned value
reporting system. BCWS is now called planned value, or PV. When
we established the three project baselines, we definitively set the cost
Figure 3-1. Cumulative work hours.
Plan
Actuals
Time
Hours
9618$$ $CH3 09-06-02 14:59:03 PS
87Cost Management
Figure 3-2. Cumulative variance reports.
Over
Under
Plan
Actuals
Time
0
and schedule baselines. Each of the activities in the project had its
own estimated cost and schedule. The PV is the cumulative budget
plotted on a time axis showing when the expenditure is supposed to
be made according to the project plan.
2. Actual cost of work performed (ACWP), or actual cost (AC). PMI
has changed this designation to actual cost, or AC. As the project
progresses, actual cost is accumulated. This cumulative actual cost
is plotted along the same time axis. The actual cost is plotted for
every reporting time period.
3. Budgeted cost of work performed (BCWP), or earned value (EV).
PMI has changed BCWP to earned value, or EV. This is the cumu-
lative plot of the value of the work actually completed. The value of
the work is equal to the budget that was estimated for the work.
The cumulative earned value is plotted on the same time axis. The
earned value is plotted every time period based on the actual work
that was accomplished.
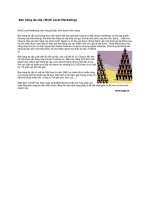
If the project follows the project plan, each of these three parameters
are exactly the same. Significant deviations between the values of the three
parameters—PV, AC, and EV—are cause for concern (figure 3-3).
Difficulties in Data Collection
Plotting the PV is rather straightforward. Care must be taken that the
timing and amounts that are plotted as PV are the same and that the timing
is the same as when they are reported as actual expenditures.
In the area of material cost, the timing of the budget and the reporting
of the actual expenditures are important. An expenditure may be recognized
when the commitment is made to purchase the material, when the material
9618$$ $CH3 09-06-02 14:59:03 PS
88 Preparing for the Project Management Professional Certification Exam
Figure 3-3. Earned value reports.
Dollars
Time
Contracted Budget
EAC
BAC
PV
AC
EV
is delivered, when the material is accepted, when it is invoiced, or when it is
paid for. All of these dates may be quite different points in time. Care must
be taken so that the timing of the PV matches the timing of the AC.
In the area of labor cost, difficulties frequently arise in the development
of these estimates as well. Companies often do not like to have their esti-
mates know the salary cost of individual employees. People are generally
grouped together by similar skills. Within the group there can be a wide
range of salaries. Since it is usually not possible to determine exactly who
will be working on a project when the work is actually done, the average
cost of a person in the group is used for estimating purposes. When the
project is actually done, the average cost of a person in the group is still used.
It may seem that this is the right thing to do, but look at the effect on
the project manager. The project manager is going to be charged the same
amount per hour regardless of which person in the group is used to do the
work. The project manager will naturally try to get the best person of the
highest skill and experience regardless of who the project really needs. This
situation creates demand for the more senior people, while the junior people
are underutilized.
A better situation would be to budget to the average cost for a person
in the skill group and then collect the actual cost according to the person’s
9618$$ $CH3 09-06-02 14:59:04 PS
89Cost Management
actual salary. This would allow the project manager to select the less skilled
person if possible and trade time and rework for lower salary cost.
Reporting Work Complete
There is frequently difficulty in reporting work complete on the proj-
ect. Many people tend to report that the percent that is complete on an
activity is the same as the percent of the time that has elapsed. Thus, if 50
percent of the time to do an activity in the project has passed but only 25
percent of the work is actually done, misleading reports could result.
There are several approaches to solving this problem. The ‘‘50-50 rule’’
is one such approach. In this approach to earned value data collection, 50
percent of the earned value is credited as earned value when the activity
begins. The remaining 50 percent of the earned value is not credited until
all of the work is completed.
The 50-50 rule encourages the project team to begin working on activi-
ties in the project, since they get 50 percent of the earned value for just
starting an activity. As time goes by, the actual cost of work performed
accumulates, and the project team is motivated to complete the work on the
activity so that the additional 50 percent of the earned value can be credited.
This creates an incentive to start work and another incentive to finish work
that has been started. This solves the problem of reporting percent complete,
and there should be few arguments about whether work has actually begun
or has been completed on a project activity.
There are many variations of the 50-50 rule. Popular variations include
the 20-80 rule and the 0-100 rule. These allow differing percentages of the
earned value of the work to be claimed at the start and completion of the
work.
Examples
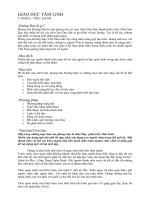
In figure 3-4, the EV is higher than the PV. This means that the project
is ahead of schedule. More activities have been completed than were planned
to be completed at this time. This can be good. The AC is higher than the
PV as well. It is also higher than the EV. This means that we are spending
more money to accomplish the work than we had planned, and we are
spending more money to accomplish work than the EV for that work.
This could mean that the manager of this part of the project is working
people overtime in anticipation of a problem that may come to pass in the
near future. There could be many explanations for these irregularities. The
report tells us that we should investigate to find out the cause for this.
9618$$ $CH3 09-06-02 14:59:05 PS
90 Preparing for the Project Management Professional Certification Exam
Figure 3-4. Earned value example A.
Cost
Overbudget
Ahead of Schedule
Today
PV
AC
EV
Time
In figure 3-5, the EV is above the PV. Again, this means that the project
is ahead of schedule. More activities are being completed, and their earned
value is being credited faster than planned. The AC is lower than the EV.
This means that we are spending less money than the earned value of the
work that is being completed.
While this looks like a good situation, ahead of schedule and under
budget, it is still not following the project plan. It is possible that things are
just going well. It is also possible that some of the work is not being done as
planned and that the quality of the work performed is suffering.
In figure 3-6, the EV is less than the PV. This means that the project
is behind schedule. The AC is less than the EV. This means that work is
being accomplished with less cost than planned. A possible explanation for
this situation is that the project is understaffed, but the people working on
the tasks that are being done are doing a better-than-average job.
Calculated Values for Earned Value Reports
• Budget at completion (BAC). The BAC is a point representing the
total budget of the project. On a cumulative plot it will be the last
point on the PV curve. The PV cannot be greater than the BAC.
9618$$ $CH3 09-06-02 14:59:05 PS
91Cost Management
Figure 3-5. Earned value example B.
Cost
Today
EV
AC
Ahead of Schedule
Underbudget
PV
Time
• Cost variance (CV).
CV ס EV מ AC
This is the difference between the work that is actually completed and the
cost expended to accomplish the work. A positive variance is good, and a
negative variance is bad.
• Schedule variance (SV).
SV ס EV מ PV
This is the difference between the work that was actually completed and the
work that was expected to be completed at this time. A positive variance is
good, and a negative variance is bad.
• Cost performance index (CPI).
CPI ס EV / AC
• Schedule performance index (SPI).
SPI ס EV / PV
9618$$ $CH3 09-06-02 14:59:07 PS
92 Preparing for the Project Management Professional Certification Exam
Figure 3-6. Earned value example C.
Cost
Today
PV
Behind Schedule
EV
AC
Underbudget
Time
Indexes are used when consistent numbers are required. Cost and schedule
variance is measured in dollars. In a large project, say $100 million, a
$100,000 cost or schedule variance might not be too significant, but in a
small project, say $300,000, a $100,000 cost or schedule variance might be
significant.
Cost and schedule variances also vary depending on what phase the
project is in. Early in the project small variances may be significant, and later
in the project these same size variances may not be terribly significant.
For this reason we use indexes. The values of indexes are the same for
the same significance. The cost performance index is the EV divided by the
AC. This is the amount of work accomplished per dollar of actual cost spent.
The schedule performance index is the EV divided by the PV. This is the
amount of work accomplished per dollar of budgeted cost expected to be
spent.
• Estimate at completion (EAC).
EAC ס BAC / CPI
9618$$ $CH3 09-06-02 14:59:08 PS
TEAMFLY
Team-Fly
®
93Cost Management
The EAC is an estimate of the project cost at the completion of the project.
This is the BAC adjusted for current performance to date, costwise. It says
that if the project continues along at its present level of performance to cost,
the EAC will be the final project cost. This is a pessimistic value since it says
that the mistakes that have been made in the project are expected to continue
for the remainder of the project.
This is often used for calculating the EAC. There are several other
forms of the EAC that can be used that yield different results. One form is
identical to the one above:
EAC ס AC ם Remaining PC / CPI
Since the remaining PV in the project is simply the difference between the
total work that must be done to complete the project (the BAC) and the
work that has been completed to date (the EV).
Remaining PV ס BAC מ EV
And the AC could be stated as:
AC ס EV / CPI
Substituting, we get:
EAC ס EV / CPI ם (BAC מ EV) / CPI
EAC ס (EV מ EV ם BAC) / CPI
EAC ס BAC / CPI
A more optimistic approach would be to assume that the mistakes on the
project that have occurred so far are not going to continue and that the
project from now on will go according to plan. It is the sum of the AC,
which is what has been spent to date and cannot be improved on now, plus
the amount of work remaining to be done.
EAC ס AC ם Remaining PV
EAC ס AC ם BAC מ EV
Of course, the most optimistic view is that not only will the project improve
its performance from now until the end of the project but also the expendi-
tures over the budget to date will be recovered by the end of the project.
This is a mistake often made by project managers. Generally speaking, if a
project is overbudget when 25 percent of the project is complete, the project
will be completed with an overbudget condition greater than 25 percent, not
less than 25 percent.
9618$$ $CH3 09-06-02 14:59:09 PS
94 Preparing for the Project Management Professional Certification Exam
• Estimate to complete (ETC).
ETC ס EAC מ AC
The ETC is the remaining budget required to complete the project if work
continues at the present performance rate.
There are many other calculations used in the earned value reporting
system, but these are the calculations that are accepted by most people (table
3-2).
Financial Measures
The business risks of a project can be best understood by looking at some of
the financial measurements that are commonly applied to business decisions.
It is important to recognize that many of the costs associated with a project
do not stop once the project has been delivered and each of the stakeholders
have accepted the project.
The simplest way to think of project desirability is to consider the
benefit cost ratio: all of the benefits of doing something divided by all of the
costs to accomplish it. Any sort of business consideration can be evaluated
with this simple measure. If the benefit cost ratio is 1.0 or greater, the project
is desirable. If it is less than 1.0, the project is not desirable.
Life cycle costing is the cost and benefits of a project that begin when
the first effort is made on behalf of the project and continue through the
conceptual phase, the planning phase, the execution phase, the closeout
phase, the warranty period, and on until the project is disposed of. When
projects are delivered to the customer, there are many costs that will continue
through the life of the project. Maintenance, service, additions, and modifi-
cations are items that will continue after delivery. Some of these will result in
additional cost, such as warranty repairs, and others will result in additional
benefits, such as additions and modifications.
‘‘Sunk cost’’ is a term used to indicate the amount of money that has
already been spent on a project. This is money that we no longer have any
control over. Although it seems that if a project is currently very much
overbudget it would make sense to complete the project and collect the
benefits, most financial managers hold that sunk costs should not be consid-
ered in making decisions as to whether to continue a project or not.
For example, a $300,000 project is 50 percent complete but is over-
budget by 30 percent. Revenue from the project is estimated to be $350,000.
Based on this information it is estimated that the project, when complete,
9618$$ $CH3 09-06-02 14:59:10 PS
Table 3-2. Earned value example.
Week PV AC EV CV SV CPI SPI EAC ETC
1 1,000 1,000 1,000 0 0 1.00 1.00 16,000.00 15,000.00
2 2,000 2,000 2,000 0 0 1.00 1.00 16,000.00 14,000.00
3 4,000 5,000 4,000 מ1,000 0 0.80 1.00 20,000.00 15,000.00
4 7,000 8,000 6,000 מ2,000 מ1,000 0.75 0.86 21,333.33 13,333.33
5 10,000 12,000 9,000 מ3,000 מ1,000 0.75 0.90 21,333.33 9,333.33
6 12,000 13,000 11,000 מ2,000 מ1,000 0.85 0.92 18,909.09 5,909.09
7 13,000 14,000 11,500 מ2,500 מ1,500 0.82 0.88 19,478.26 5,478.26
8 14,000 14,500 13,000 מ1,500 מ1,000 0.90 0.93 17,846.15 3,346.15
9 15,000 15,000 14,500 מ500 מ500 0.97 0.97 16,551.72 1,551.72
10 16,000 16,000 15,500 מ500 מ500 0.97 0.97 16,516.13 516.13
11 16,000 17,000 16,000 מ1,000 0 0.94 1.00 17,000.00 0.00
BAC 16,000
9618$$ $CH3 09-06-02 14:59:10 PS
95
Cost Management
96 Preparing for the Project Management Professional Certification Exam
will cost $400,000. Should the project be continued? If the project stops
today, $200,000 is sunk cost, and no revenue is made. If the project is
completed, a loss of $50,000 will occur. From the point of view of many
managers, all other things being equal, it would be better to stop the project
and invest the remaining $250,000 that it would have taken to complete
the project in another project that is more profitable. Of course, customer
commitments and future revenue based on the completion of this project
may influence this decision.
Financial measures are rooted in the accounting and financial worlds.
The first things that must be understood is that the fundamental reports in
accounting—the income statement and the balance sheet—are of particular
interest to the project manager, since the project manager’s decisions directly
influence these reports. The current trend in project management is to make
project managers responsible for the revenue cost and expenses of the proj-
ect. These are the basic reports of accounting for any business. In these
statements, the words profit and income are frequently interchanged. The
reason that project managers must be aware of these financial measures is
that if the financial measures applied to the project are favorable and the
company can keep all of its projects favorable, then the company’s financial
measures will also be favorable. The fundamental accounting equation is:
Assets ס Liabilities ם Owners equity
Assets are the things that a company owns, like cash, buildings, materi-
als, and so on. Liabilities are what a company owes, such as unpaid bills,
long- and short-term debt, and so on. The owner’s equity is the value of the
assets after the liabilities have been subtracted. In the successful operation of
a company, the company takes on liabilities in order to produce goods and
services that are then sold. When the goods and services are sold there is,
hopefully, a positive difference in revenue generated versus costs and ex-
penses incurred to allow the goods and services to be sold. At the end of a
project the assets that are increased should be greater than the liabilities
incurred. To balance the accounting equation, this difference increases the
owner’s equity.
The income statement (figure 3-7) shows where the cash flowing into
and out of the company came from, and the net profit after taxes is the sum
of all the money flowing into the company and all of the money flowing out
of the company.
The balance sheet (figure 3-8) is the statement that shows a breakdown
9618$$ $CH3 09-06-02 14:59:11 PS
97Cost Management
Figure 3-7. Income statement.
Gross sales
Less cost of goods sold
= Gross profit
Less operating expenses
Salaries and commissions
Rent expenses
Depreciation
Selling expenses
Other operating expenses
= Net operating income
Plus other income
Interest revenue
Less other expenses
Interest expense
= Net income before taxes
Less income tax
= Net income after taxes
of the items in the fundamental accounting equation. The assets must bal-
ance the liabilities and owner’s equity.
Project managers have an influence on the numbers on the company’s
financial reports. But the company’s reports are just the summation of the
different projects and other activities of the company. It is therefore sensible
to consider these financial measures as they apply to the individual projects
as well. If all projects being done by the company are individually profitable,
then the company itself must be profitable. These measures are frequently
called financial ratios.
Return on Sales
Return on sales, or ROS, equals the net profit after taxes divided by the
gross sales. This is another way of saying how much profit is generated for
each dollar of sales. The higher the value of ROS the better. Typically, for
American business this ratio is usually nearly 5 percent. Note that the net
profit after taxes is what is left of the revenue after all costs, expenses, and
taxes have been deducted. Net profit is sometimes called the net operating
profit after taxes, or NOPAT.
For example, a project generates revenue of $400,000. After deducting
9618$$ $CH3 09-06-02 14:59:12 PS
98 Preparing for the Project Management Professional Certification Exam
Figure 3-8. Balance sheet.
Assets:
Current assets
Cash
Accounts receivable
Inventory
Prepaid expenses
Fixed assets
Plants and equipment
Furniture and fixtures
Less accumulated depreciation
Total assets
Liabilities:
Current liabilities
Accounts payable
Unpaid salaries
Long-term liabilities
Long-term debt
Owner’s equity:
Common stock
Preferred stock
Retained earnings
the project’s share of all the costs, expenses, and taxes, the net profit after
taxes is $23,000.
ROS ס NOPAT / Gross revenue
ROS ס $23,000 / $400,000
ROS ס 5.75%
Return on Assets
Return on assets, or ROA, equals the net profit after taxes divided by
total assets. This is another way of saying how much profit was generated
for each dollar of investment in the company. The higher the value of ROA
the better. Typically, for American business, this value is nearly 9 percent.
Since the assets of a company represent the money that is invested in the
company, it is important to know how much profit is being made per dollar
of investment.
For example, a project uses a share of the company’s assets equal to
9618$$ $CH3 09-06-02 14:59:14 PS
99Cost Management
$240,000. After deducting the project’s share of all of the costs, expenses,
and taxes, the net profit after taxes is $23,000.
ROA ס NOPAT / Total assets
ROA ס $23,000 / $240,000
ROA ס 9.6%
Economic Value Added
The economic value added is also called the EVA. In this financial
measurement we are interested in finding if a project’s NOPAT is sufficient
to cover the cost of maintaining the assets that it uses. In other words, if a
project uses a share of the company’s assets, those assets have certain expenses
associated with them. These expenses are the cost of interest on borrowed
funds and the compensation paid to shareholders in the company. The ratio-
nale here is that the only way a company can acquire assets is by borrowing
the money to purchase them, having investors purchase stock in the com-
pany, or generating profits. Organizations that lend money to companies are
compensated in the form on interest payments. Stockholders are compen-
sated in the form of dividends on their share of the company. The revenue
generated by the project must be enough to meet all of the project’s costs
and expenses as well as offset the interest expense and dividends to the stock-
holders.
The first thing we will have to calculate is the cost of capital. This is
the weighted average cost of the money paid to the stockholders in the form
of dividends and the money paid to the lenders in the form of interest
payments.
Suppose a company’s assets are financed by 70 percent in stock sold to
investors and 30 percent in funds borrowed from banks and other financial
institutions in the form of loans. The average interest that is paid on the
loans is 7 percent, and the company dividends are 17 percent. What is the
cost of capital for this company?
Seventy dollars out of every $100 of the company’s assets are financed
by stockholders at 17 percent, or $11.90 per year. Thirty dollars of every
$100 of the company’s assets are financed by lenders at 7 percent, or $2.10
per year. The total cost of capital per $100 is $14, or 14 percent of the
company’s assets.
If we take the capital or the assets that are used for this project and
multiply by the cost of capital, we will get the weighted average cost of
capital (WACC).
Let’s say that the capital that the project uses is $500,000 and the cost
of capital is 14 percent:
9618$$ $CH3 09-06-02 14:59:14 PS
100 Preparing for the Project Management Professional Certification Exam
WACC ס $500,000 ן 14% ס $70,000
If the net operating profit after taxes is $116,000:
EVA ס NOPAT מ WACC
EVA ס $116,000 מ $70,000
Project economic value added, or EVA, would be $46,000
Depreciation
Depreciation is a necessary function in financial management, because with-
out depreciation the irregularities in the fundamental financial reports of a
company would vary considerably and make it difficult to compare one year
or one quarter to the next. This is because large investments in assets do not
occur on a regular basis. If the total cost of an investment were reflected in
the financial time period in which it occurred, the effect on net profits would
be considerable in this period, and then the net profit would rise significantly
in the next period.
What is done with depreciation? The cost of the new asset is spread out
over the life of the asset. This allows the company to claim some of the cost
each year rather than the total cost of the asset all at one time.
Straight Line Depreciation
Straight line depreciation is the depreciation method that allows an
equal amount of depreciation to be taken each year. The amount of depreci-
ation is determined by subtracting the salvage value of the asset at the end
of its useful life from the purchase price of the asset. The remaining value is
called the book value. The book value is divided by the number of years,
and this amount is expensed from the asset each year.
For example, a company buys a large machine for $1 million. The
purchase is made with cash. In the accounts for this transaction, the cash
account is reduced by $1 million, and the machine account is increased by
the amount of $1 million. There is no effect on the liabilities or owner’s
equity side of the accounting equation and it remains balanced. The cost of
this machine must eventually be recognized.
The machine has a useful life of ten years and is worth $100,000 at the
end of its useful life in terms of scrap value or the ability to sell the machine
to someone else. This means that the value of the machine that must be
depreciated is $900,000. Since the life of the machine is ten years, the value
depreciated each year is $90,000. This is known as straight line depreciation
(table 3-3).
9618$$ $CH3 09-06-02 14:59:15 PS
101Cost Management
Table 3-3. Straight line depreciation.
Purchase Salvage Current
Year Price Value Depreciation Book Value
0 1,000,000 100,000 0 900,000
1 90,000 810,000
2 90,000 720,000
3 90,000 630,000
4 90,000 540,000
5 90,000 450,000
6 90,000 360,000
7 90,000 270,000
8 90,000 180,000
9 90,000 90,000
10 90,000 0
Total 900,000
Accelerated Depreciation
Accelerated depreciation methods are used to allow the expenses that
are depreciated from the assets to be applied earlier in the useful life of the
asset. The reason for this is to reduce the net profit after taxes (NOPAT). If
NOPAT is reduced in a given year, the amount of tax that a company pays
is less by this amount.
In accelerated depreciation methods the total amount of depreciation
is the same as in straight line depreciation, but the time that it is taken is
much earlier in the useful life of the asset. This means that more equipment
expense is recognized and lower taxes are paid in the early part of the useful
life of the asset purchased. In later years the taxes will be higher than in
straight line depreciation. Because of the present value of the money, taxes
that are deferred to later years allow us to use that money in the present
years.
Two types of accelerated depreciation are commonly used: sum of the
years’ digits and double declining balances.
Sum of the Years’ Digits. There is no scientific basis for the sum of the
years’ digits method. There is no financial reason for using this calculation
except that it has become a standard accounting practice.
The calculation is made by totaling the digits representing the years of
the useful life of the equipment. Thus, as can be seen in table 3-4, for a ten
year useful life, the total is 55 (10 ם 9 ם 8 ם 7 ם 6 ם 5 ם 4 ם 3 ם 2
ם 1 ס 55).
9618$$ $CH3 09-06-02 14:59:16 PS